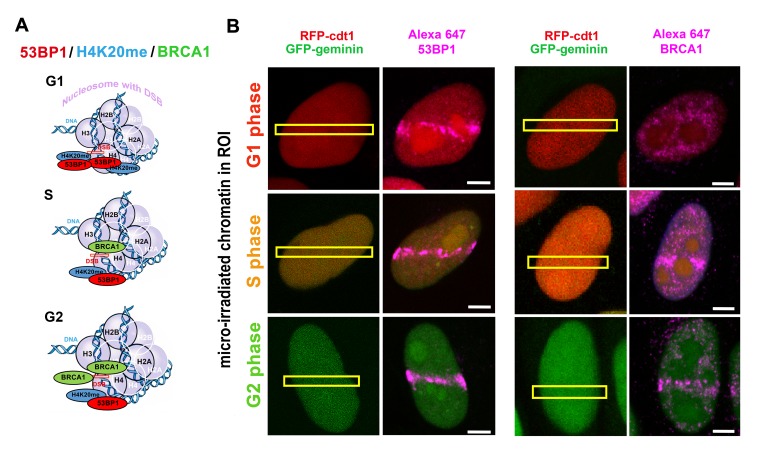
Figure 1.
(A) Illustration of the levels of 53BP1, H4K20me2/me3 and BRCA1 in the G1, S and G2 phases of the cell cycle. (B) An example of recruitment of the 53BP1 protein and BRCA1 (both violet) to locally induced DNA lesions by laser microirradiation in the G1 (red), S (orange) and G2 cell cycle phases. HeLa-Fucci cells that expressed RFP-tagged Cdt1 (red) in the G1 phase and GFP-tagged geminin in the G2 phase were used. This figure shows maximal projection from 60 optical sections (in each example) and provides a pictorial illustration of the 53BP1 and BRCA1 levels in the G1, S, and G2 phases of the cell cycle as published elsewhere. Due to both RFP-ctd1 and GFP-geminin expression, cells were fixed by formaldehyde, and immunostaining with an antibody against 53BP1 or BRCA1 was performed (see Alexa-647 stained 53BP1 or BRCA1). For methodology explaining immunofluorescence and the use of local laser microirradiation, see [161].

