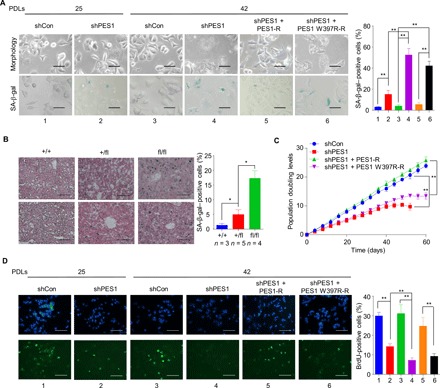
Fig. 5. PES1 KD or KO triggers senescence.

(A) Cells from Fig. 4F were captured by microscopy (top) and subjected to SA-β-gal staining (bottom). The percentage of SA-β-gal–positive cells on the right was calculated from five randomly chosen fields. At least 150 cells were analyzed per experiment. Scale bars, 50 μm. Data shown are mean ± SD of three independent experiments. **P < 0.01. (B) Representative frozen liver sections from liver-specific PES1 KO mice at 3 months were subjected to SA-β-gal staining followed by eosin staining. The PES1+/+ and PES1+/f mice were littermates of the PES1f/f mice. Scale bars, 100 μm. *P < 0.05. (C) Growth curves of representative MCF7 monoclones stably expressing PES1 shRNA (shPES1) or control shRNA (shCon) and shRNA-resistant WT or mutated PES1 from 34 PDLs. (D) Cells from Fig. 4F were labeled with BrdU and stained with anti-BrdU. Scale bars, 100 μm. Data shown are mean ± SD of three independent experiments. **P < 0.01.
