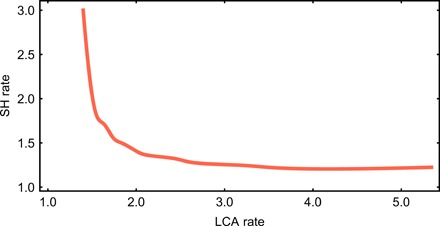
Fig. 3. Relationship between the evolutionary rate at the SH branch and at the LCA branch.

Relationship observed when analyzing the first phylogenetic scenario (phylogeny-1). Evolutionary rates at both branches show an inverse and nonlinear relationship such that very high rates at the SH branch are associated with very low rates at the LCA branch and vice versa. This effect can be visualized in Fig. 2, which shows how these rates change depending on the assumed SH–modern human divergence time.
