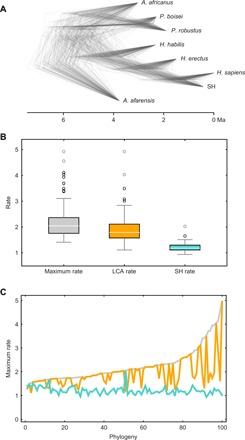
Fig. 4. Variation of evolutionary rates obtained through the analysis of 100 trees.

(A) Densitree showing the sample of 100 randomly selected trees used in the calculations. (B) Boxplot comparing the maximum evolutionary rate (gray), the LCA rate (orange), and the SH rate (teal) in the 100 phylogenies. (C) Evolutionary rates obtained in the analysis of each of the 100 phylogenies showing the maximum rate across the tree (gray), the LCA rate (orange), and the SH rate (teal). Phylogenies in (C) are sorted according to their maximum evolutionary rate. The plot shows that the LCA rate is the maximum rate in a majority of phylogenies (59 of 100), whereas the SH rate is the maximum rate only in three phylogenies. In all other cases, the maximum rate is found in other branches (in most cases, in the P. boisei branch).
