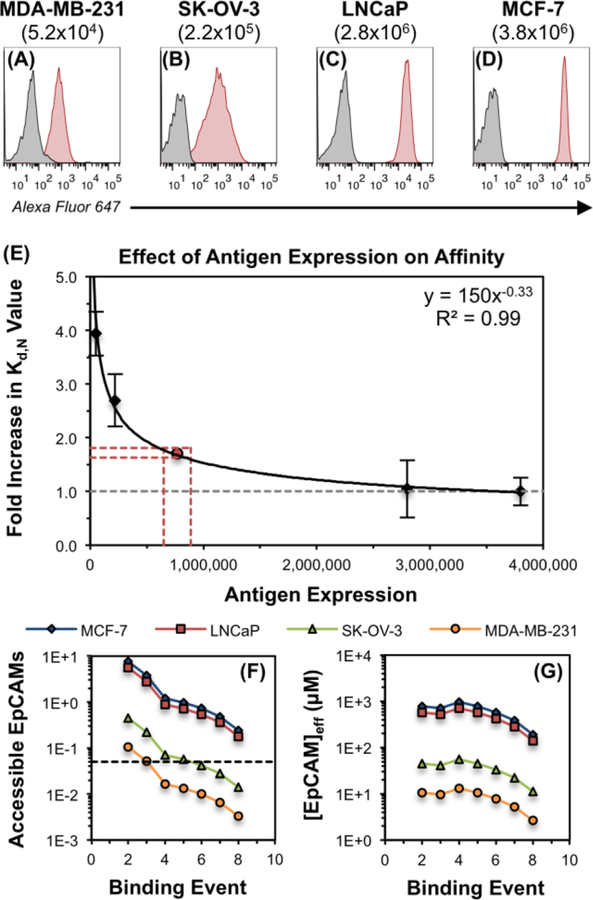
Figure 4. Apparent Affinity Varies with Antigen Expression Density.
(A–D) The absolute EpCAM expression of four cell lines was quantitated via flow cytometry by comparing the mean fluorescence intensity of the cellular samples to those of standard calibration beads. Values in parentheses represent mean numbers of EpCAM/cell. Experiments were performed in triplicate, and a representative histogram is shown for each cell line. (E) To isolate the effect of EpCAM expression density on the apparent affinity of the CSAN scaffold, fully-targeted CSANs utilizing clone C5 (8:0 C5:NT) were titrated against the same four EpCAM-expressing cell lines shown in panels A–D. The minimum apparent Kd,N value (6.9 ± 1.8 nM) was obtained when the CSANs were bound to the MCF-7 cells; therefore, this value was chosen as the baseline (i.e, value of 1.0) and is represented by the dashed grey line. The apparent Kd,N values obtained for the LNCaP (7.2 ± 3.7 nM), SK-OV-3 (19 ± 3.4 nM), and MDA-MB-231 (27 ± 2.8 nM) were scaled relative to the MCF-7 Kd,N value to provide the fold by which the apparent Kd,N had been increased. This “fold increase in Kd,N value” is plotted against the quantitated number of EpCAMs/cell, providing a local fit within the confines of this data set. The relationship was fit to a power regression curve, as this model provided the best coefficient of determination (R2 value). Each titration was performed at least three times, and data is presented as the mean ± standard deviation of the fold increase in the apparent Kd,N values resulting from these independent trials. The red lines and dot indicate the threshold number of EpCAMs/cell needed to permit theoretical octavalent CSAN binding to the cells, per the model proposed in the main text. (F) The theoretical number of EpCAMs accessible to the CSAN at each of the eight binding events. The black dashed line indicates the threshold number of accessible EpCAMs needed to permit octavalent CSAN binding to the cells. (G) The theoretical effective molarity of EpCAMs accessible to the CSAN at each of the eight binding events. See Figure S5 for additional details regarding the model used to produce panels (F–G) and the associated threshold values.

