
Figure 2. Distribution of Mouse Clock CpGs across the Genome.
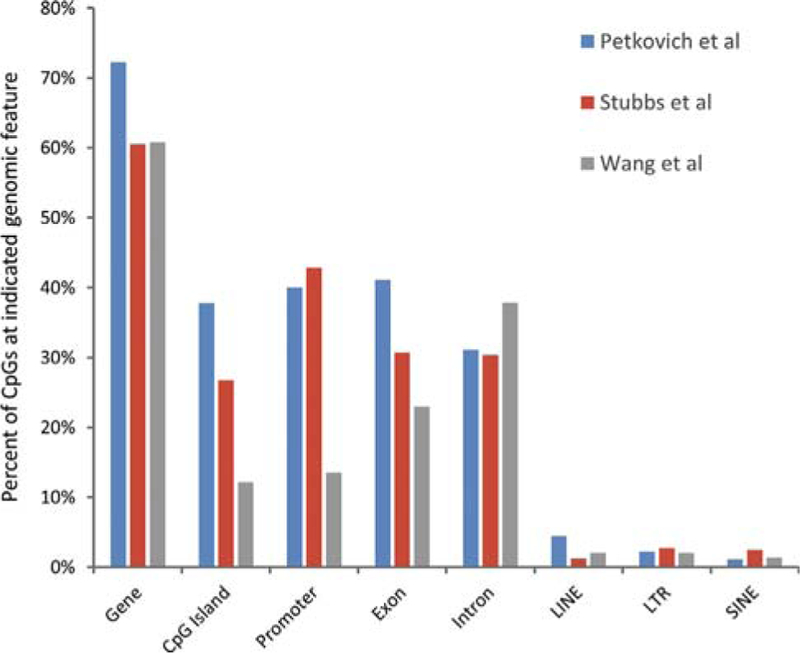
The mouse clock CpGs described by Petkovich et al. (2017), Stubbs et al. (20 7), and Wang etal. (2017) were assigned to the indicated genome features. Some CpGs map to more than one feature. Hence, the sum of percentages for any one mouse clock is greater than 100.