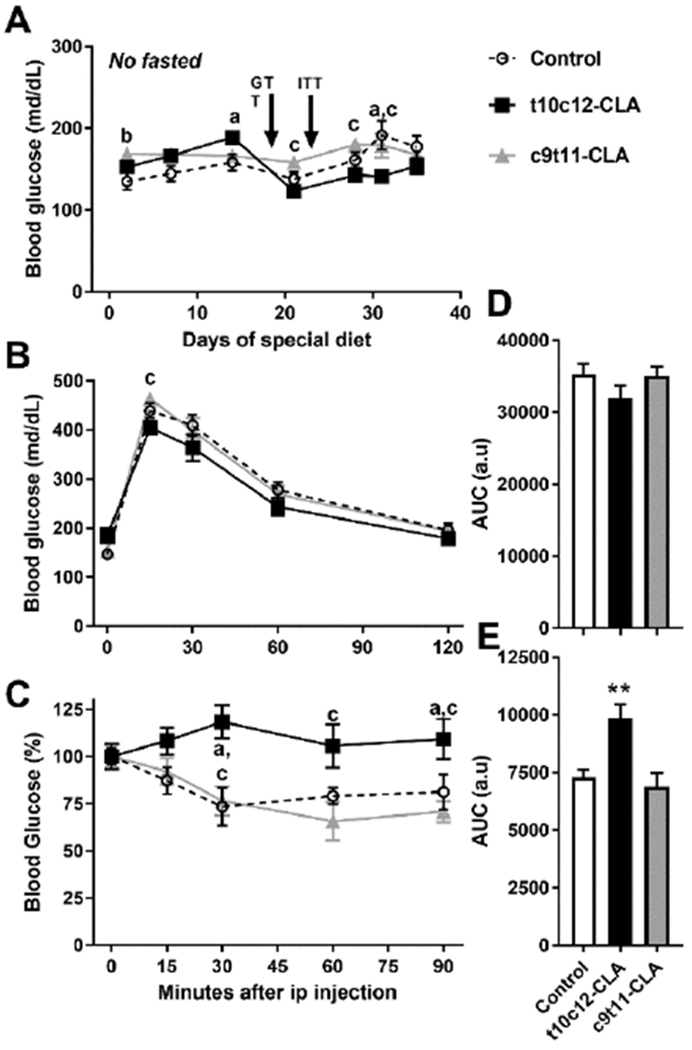
Figure 5. Mice fed a diet containing t10c12-CLA show normal glucose levels and clearance of circulating glucose, but develop insulin resistance.

A) Blood glucose was assessed in mice at 1200h, food was withdrawn at 0800h. B) Glucose tolerance test, 2g/kg ip was performed in overnight fasted mice at 0900h. C) Insulin tolerance test, 1.5U/kg ip was peformed in mice at 1200h, food was withdrawn at 0800h. Open circle, discontinuous line (control diet), black squares, black line (t10c12-CLA diet), grey triangles, grey line (c9t11-CLA diet). Data are represented as means +/− SEM, and analyzed by two-way ANOVA (A-C) or one-way ANOVA (D-E) followed by a Tukey posthoc analysis. Letters indicate significant differences between groups within a time point: a, control vs t10c12-CLA; b, control vs c9t11-CLA; c, t10c12-CLA vs c9t11-CLA. p<0.05. Asterisks indicate differences between control and t10c12-CLA, **, p<0.01. N= 6-12mice/group.
