
Fig. 5.
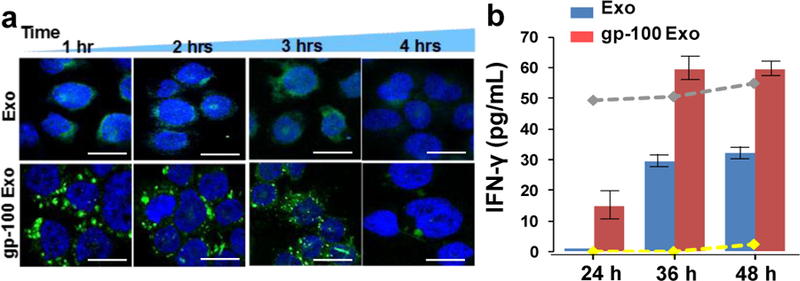
a) The confocal microscopic image of DC uptake of TTA peptide gp-100 surface engineered exosomes, compared with non-engineered native exosomes. The image was taken every one hour for tracking the green fluorescence labeled exosomes uptake by DCs (cell nucleus were stained with DAPI ). The scale bar is about 5 μm. b) The release of Cytokine IFN-ɤ from DCs culture under stimulations between native exosomes and gp-100 engineered exosomes. The gray dash line indicates the positive control using pokeweed mitogen protein as the stimulator. The yellow dash line is the negative control without any stimulator. The error bar shows the three repeats with average measurement (RSD is ~5%).