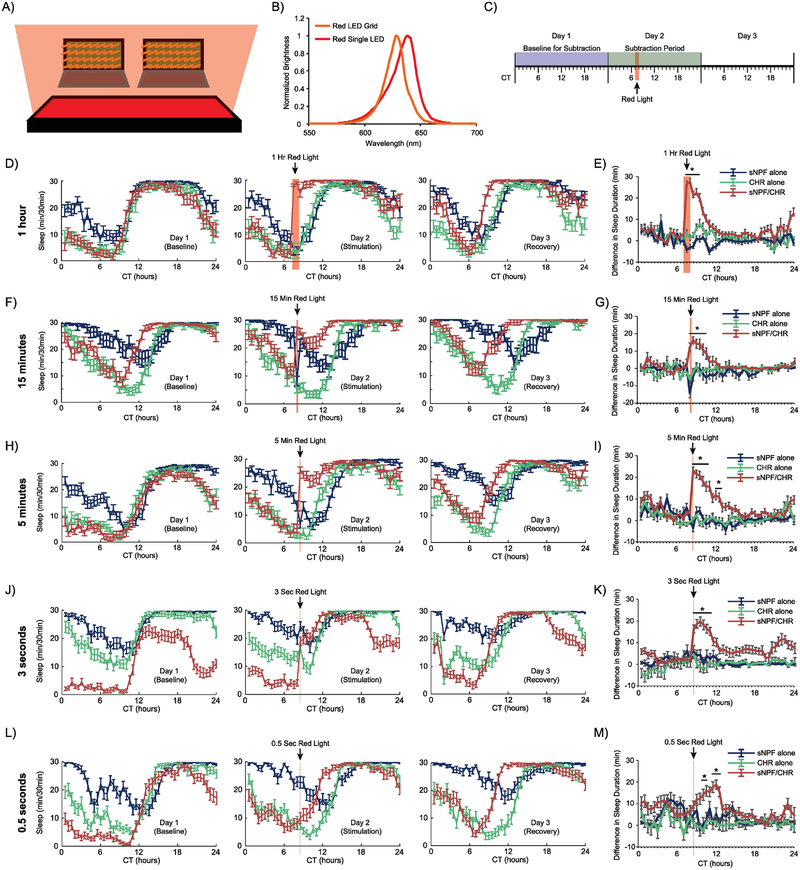
Figure 1. Optogenetic activation of sNPF neurons when female flies are active promotes long-lasting increases in sleep.
(A) Schematic representing the experimental setup. Female flies were placed in DAM2 monitors just above a red LED illuminator grid. (B) Plots of the spectral ranges of the red LED grid used for all sleep experiments and the single red LED used in the experiments whose results are shown in Figure 5. (C) A general timeline of the experiments whose data are shown in this figure. Red light stimulation for 1 hour, 15 minutes, 5 minutes, 3 seconds, or 0.5 seconds was provided at CT7–8 in conditions of otherwise total darkness. Minutes of sleep per 30-min bin were recorded. To determine how much sleep was altered by red light stimulation, subtraction plots were created by subtracting the amount of sleep during each 30-minute bin during the Baseline for Subtraction from the amount of sleep during the 30-minute bin from the same circadian time of day during the Subtraction Period. (D, F, H, J, L) Sleep patterns across the 3 experimental days for the 1-hour, 15-minute, 5-minute, 3-second, and 0.5-second stimulation experiments, respectively. (E, G, I, K, M) Subtraction plots for the 1-hour, 15-minute, 5-minute, 3-second, and 0.5-second stimulation experiments, respectively. 1 hour of stimulation caused the greatest magnitude initial increase in sleep, but all stimulation paradigms resulted in significantly increased sleep that took hours to decay back to baseline. Error bars represent the standard error of the mean, and * represents a post-hoc comparison with p < 0.05. The numbers of experimental animals were as follows, for sNPF alone, CHR alone, and sNPF/CHR groups, respectively: 1-hour experiment – 28, 29, 27; 15-minute experiment – 20, 30, 32; 5-minute experiment – 32, 31, 30; 3-second experiment – 31, 32, 32; and 0.5-second experiment – 31, 31, 31.

