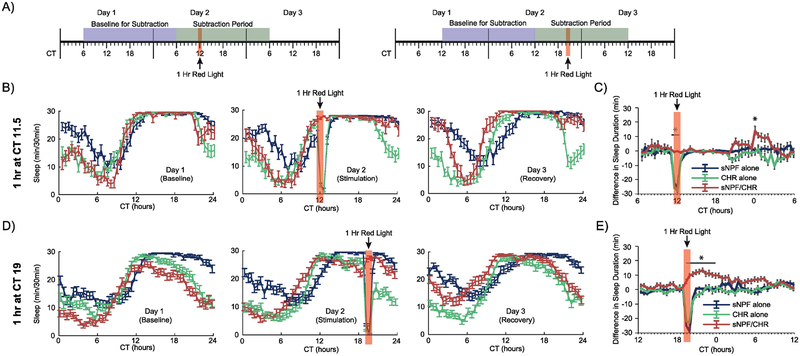
Figure 2. Optogenetic activation of sNPF neurons at times when female flies are already sleeping.
(A) Timelines of the experiments whose data are shown in this figure. Red light stimulation for 1 hour was provided at either CT11.5 or CT19 in conditions of otherwise total darkness. All experimental animals in these experiments were females. Data were analyzed as in Figure 1, with the exception that the 24-hour Subtraction Period and Baseline for Subtraction were shifted based on the timing of the red light stimulation. (B, D) Sleep patterns across the 3 experimental days for the CT11.5 and CT19 experiments, respectively. (C, E) Subtraction plots for the CT11.5 and CT19 experiments, respectively. Red light stimulation in these experiments woke up control flies, but experimental flies were kept asleep. Further, they showed delayed increases in sleep at points when they would normally have started waking up. Error bars represent the standard error of the mean, and * represents a post-hoc comparison with p < 0.05. The numbers of experimental animals were as follows, for sNPF alone, CHR alone, and sNPF/CHR groups, respectively: CT11.5 experiment – 32, 32, 19; and CT19 experiment – 61, 58, 65.

