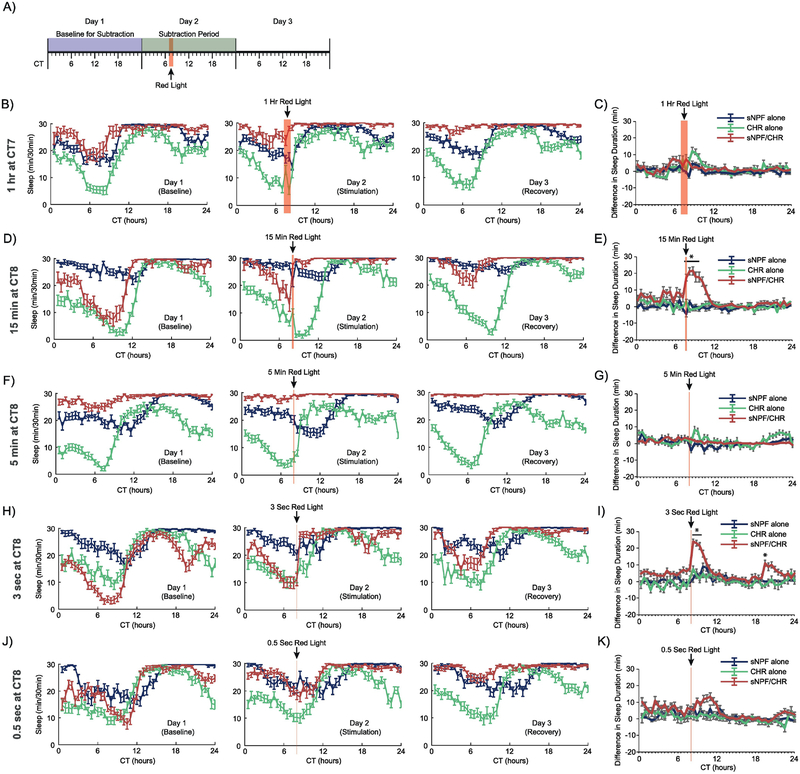
Figure 3. Optogenetic activation of sNPF neurons in male flies during subjective day.
This figure depicts the results from male animals from four separate optogenetic activation experiments. (A) A general timeline of the experiments whose data are shown in this figure. (B, D, F, H, J) Sleep patterns across the 3 experimental days for the 1 hr at CT7, 15 min at CT8, 5 min at CT8, 3 sec at CT8, and 0.5 sec at CT8 experiments, respectively. (C, E, G, I, K) Subtraction plots for the same four experiments, respectively. In some of these experiments, the high levels of sleep in male animals made it difficult to observe sleep induction during the red light stimulation (but see the 15 min and 3 sec experiments, in which males were awake enough to show a significant increase in sleep). Error bars represent the standard error of the mean, and * represents a post-hoc comparison with p < 0.05. The numbers of experimental animals were as follows, for sNPF alone, CHR alone, and sNPF/CHR groups, respectively: 1-hour experiment – 29, 29, 14; 15-minute experiment –32, 30, 23; 5-minute experiment – 32, 32, 30; 3-second experiment – 31, 30, 31; and 0.5-second experiment – 31, 28, 32.

