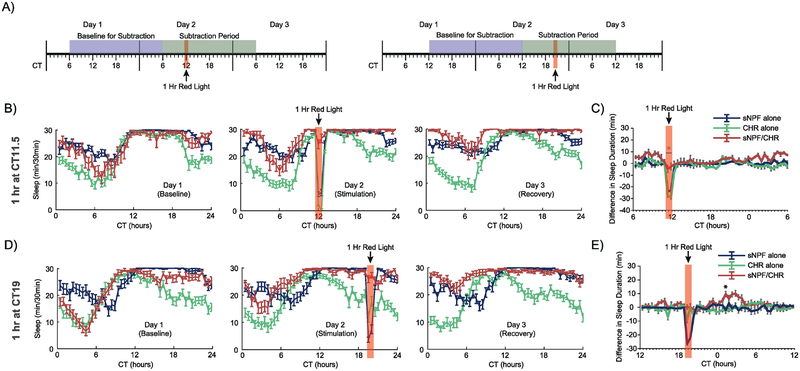
Figure 4. Optogenetic activation of sNPF neurons in male flies during subjective night.
(A) Timelines of the experiments whose data are shown in this figure. Red light stimulation for 1 hour was provided at either CT11.5 or CT19 in conditions of otherwise total darkness. All experimental animals in these experiments were males. (B, D) Sleep patterns across the 3 experimental days for the 1 hr at CT11.5 and 1 hr at CT19 experiments, respectively. (C, E) Subtraction plots for the same two experiments. As in the previous figure, high levels of sleep in male animals made it difficult to assess sleep induction due to the red light stimulation. Error bars represent the standard error of the mean, and * represents a post-hoc comparison with p < 0.05. The numbers of experimental animals were as follows, for sNPF alone, CHR alone, and sNPF/CHR groups, respectively: CT11.5 experiment – 32, 32 15; and for CT19 experiment – 32, 29, 31.

