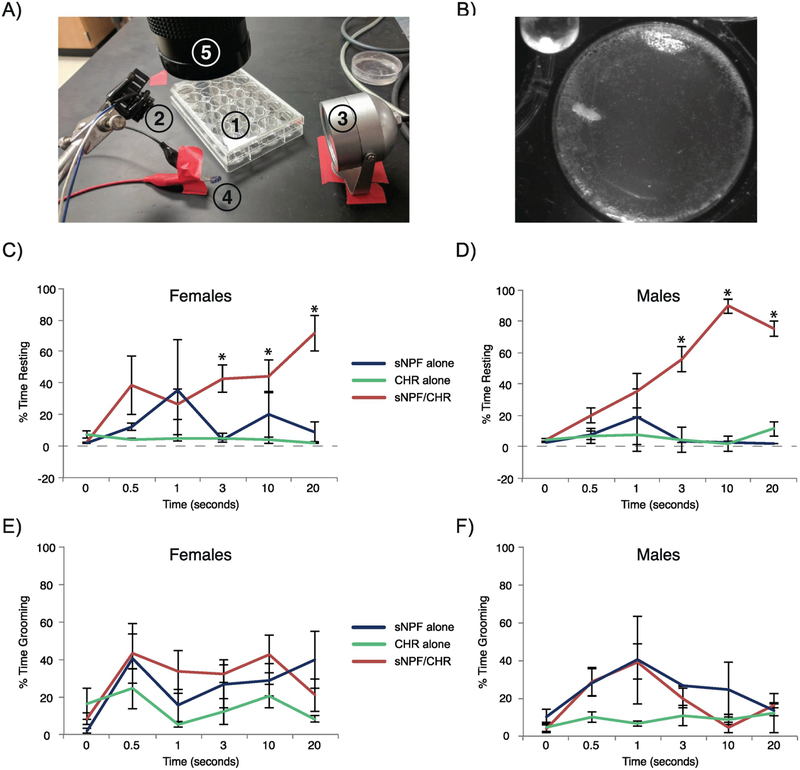
Figure 5. Brief optogenetic activation of flies causes similar reductions in movement in female and male flies.
Individual flies were placed in a small chamber and videotaped under infrared light. After a 30-second baseline, a red light pulse was delivered for 0, 0.5, 1, 3, 10, or 20 seconds. Videos were subsequently scored for movement across the subsequent four 1-minute bins. (A) Image showing the elements of the experimental setup. #1 is a 24-well plate containing recording chambers partially filled with agarose. #2 is the red LED for optogenetic stimulation, #3 is an infrared illuminator for background light, #4 is an infrared-emitting indicator light, and #5 is a camera for video recording, fitted with an long-pass filter. (B) A sample image of a recording, showing the size of the chamber relative to that of the fly. The infrared indicator light can be seen in the top left corner. (C-D) Plots showing the percentage of time spent resting during the 4 minutes following optogenetic stimulation in female and male flies, respectively. (E-F) Plots showing the percentage of time spent grooming during the 4 minutes following optogenetic stimulation in female and male flies, respectively. Error bars represent the standard error of the mean, * represents post-hoc comparisons between genotypes at a given stimulation duration for which male and female sNPF/CHR flies combined were significantly different than both control groups at p < 0.05. All experimental groups had 3–5 animals, except the male, sNPF alone, 1-second stimulation group, in which only 2 videos were usable.

