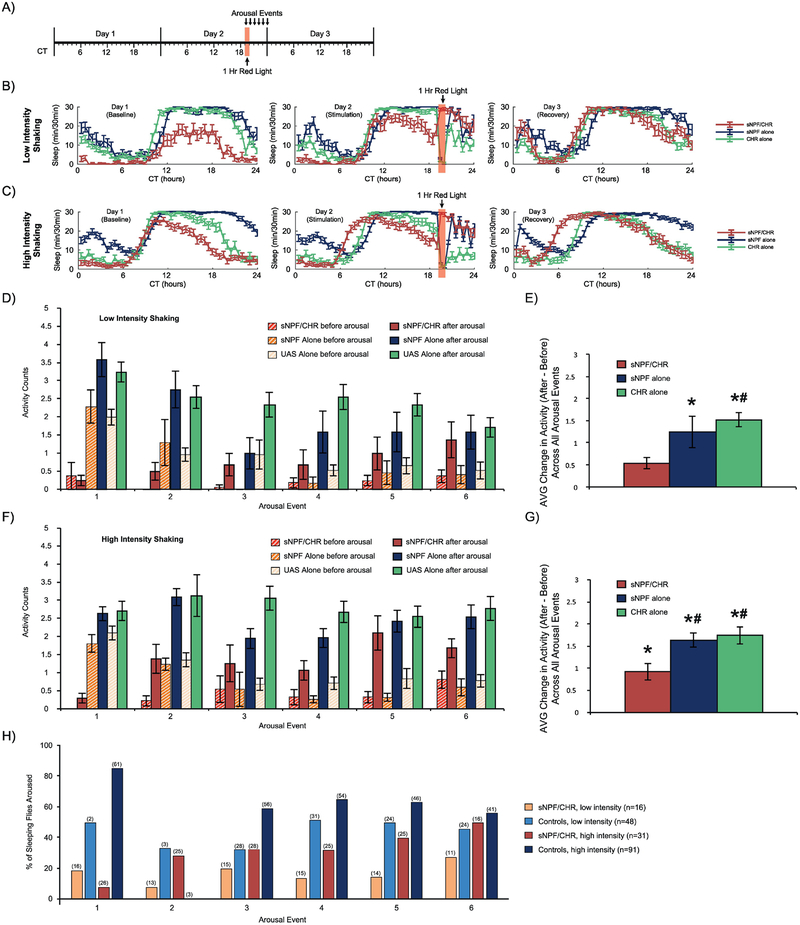
Figure 7. Flies in optogenetically induced sleep can be aroused by mechanical stimulation.
(A) Timeline for both of the experiments whose data are shown in this figure. Red light stimulation for 1 hour was provided at CT19 in conditions of otherwise total darkness. Mechanical arousal stimuli at either Low Intensity or High Intensity were provided for 0.5 seconds every hour for 6 hours, with the first stimulation taking place 5 minutes into the red light stimulation. All experimental animals in these experiments were females. (B-C) Sleep patterns across the 3 experimental days for the Low Intensity and High Intensity experiments, respectively. (D-E) Results from the Low Intensity shaking experiment. (F-G) Results from the High Intensity shaking experiment. (D, F) Quantification of activity counts (beam breaks) during the minute pre-arousal compared with the first minute post-arousal, separately for each arousal event. (E, G) Comparison of the change in activity induced by arousal, averaged across all 6 arousal events. (H) Visualization of the % of sleeping flies that were awoken by the mechanical stimulation. For clarity, the sNPF alone and CHR alone control groups were combined into a single Controls group for each stimulation intensity. Although the % of sleeping flies that were aroused was typically smaller for the sNPF/CHR flies than for the Controls, sNPF/CHR flies could be aroused from sleep, and were aroused more frequently with greater shaking intensity. Error bars in panels B-C represent the standard error of the mean, and the numbers in parentheses in panel D represent the number of sleeping flies in each group. The total numbers of experimental animals were as follows, for sNPF alone, CHR alone, and sNPF/CHR groups, respectively: Low Intensity shaking experiment – 31, 17, 16; High Intensity shaking experiment – 25, 31, 31.

