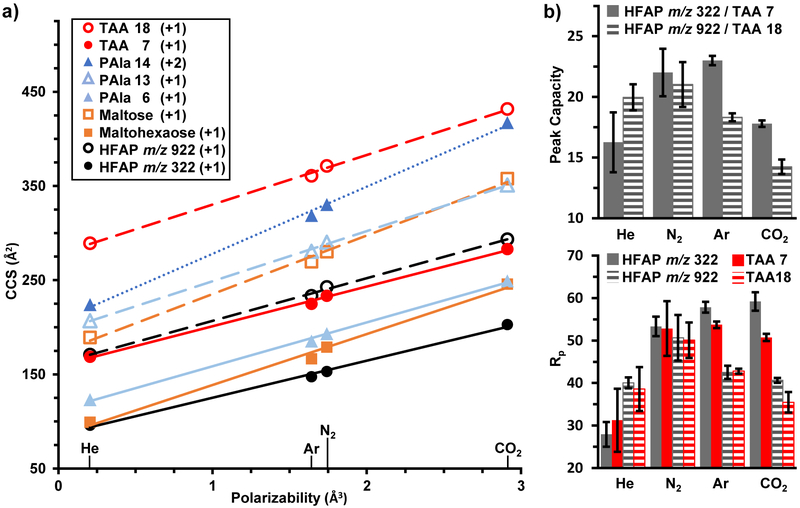
Figure 6.
(a) The CCS for select ions plotted against the polarizability of the drift gas as given in the CRC Handbook of Chemistry and Physics [45]. All ions are singly charged except polyalanine 14-mer (PAla 14) which is doubly charged. Increasing the polarizability of the drift gas is correlated with an increase in CCS. However, the relative change in CCS with the drift gas polarizability is both class and charge-state specific, as indicated by the different slopes. The slope, intercept, and regression coefficient values are given in Table S5. Error bars are within the marker size. (b) Resolving power (Rp) and peak capacity bar graphs for each drift gas. Maximum Rp values are shown, requiring a different drift field for He (8.3 V/cm) versus the other drift gases (16.0 V/cm). Peak capacity was calculated between HFAP and TAA cations of similar mass. Error bars were based on five measurements conducted on different days.

