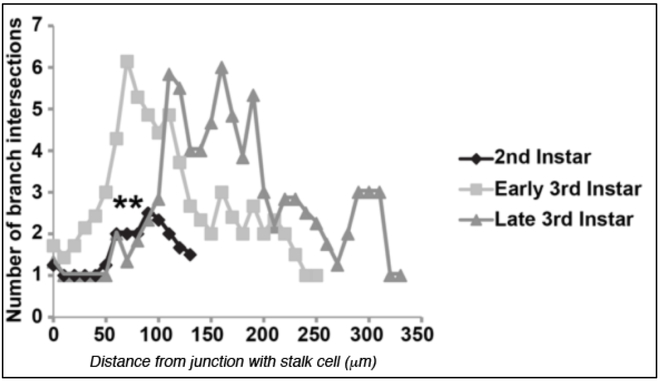
Figure 2: Branch complexity increases dramatically between 2nd and early 3rd instar.
A Sholl analysis of branching complexity was performed at 2nd, early 3rd, and late 3rd instar. In all cases, terminal cells from the 5th tracheal metamere were examined (tr5). The distance from the stalk cell junction at which the circles intersect terminal cell branches are indicated on the X-axis while the number of branches crossed by the circles are indicated on the Y-axis. ** indicates a T Test value of p<0.01 for the comparison of 2nd instar data with that of early and of late 3rd instar, with 7, 7 and 6 terminal cells scored for each stage, respectively.

