
Figure 3.
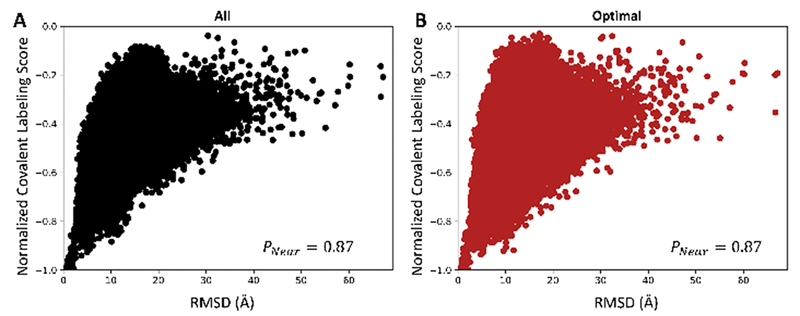
Normalized covalent labeling score distributions for the combined 194,100 decoy models. Panel (A) shows the distribution using all 20 amino acid types to calculate the normalized covalent_labeling_cen and panel (B) shows the “optimal” distribution containing only the residues G, R, K, L, T, F, S, V, and D.