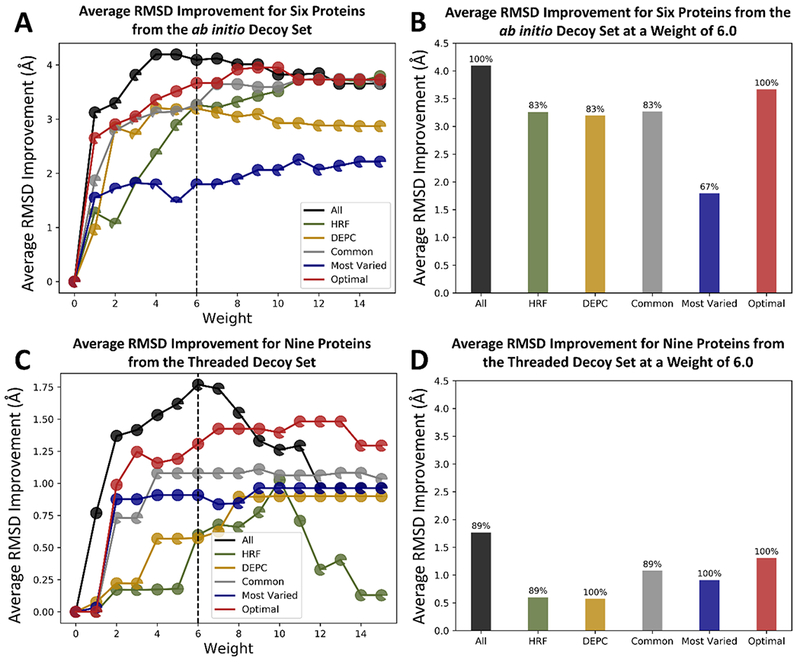
Figure 4.

Plots of the average RMSD improvement for (A) the six ab initio proteins and (C) the nine threaded proteins with sub 5Å RMSD models before and after rescoring with covalent_labeling_fa at various weights for each of the residue type sets. Each data point is shown as a pie chart representing the fraction of proteins that exhibited either an improved or the same RMSD upon rescoring with covalent_labeling_fa. Panels (B) and (D) show the average RMSD improvement for the six ab initio and nine threaded proteins, respectively, at a weight of 6. The fraction of proteins that improved or stayed the same is represented as the percentage above each bar.
