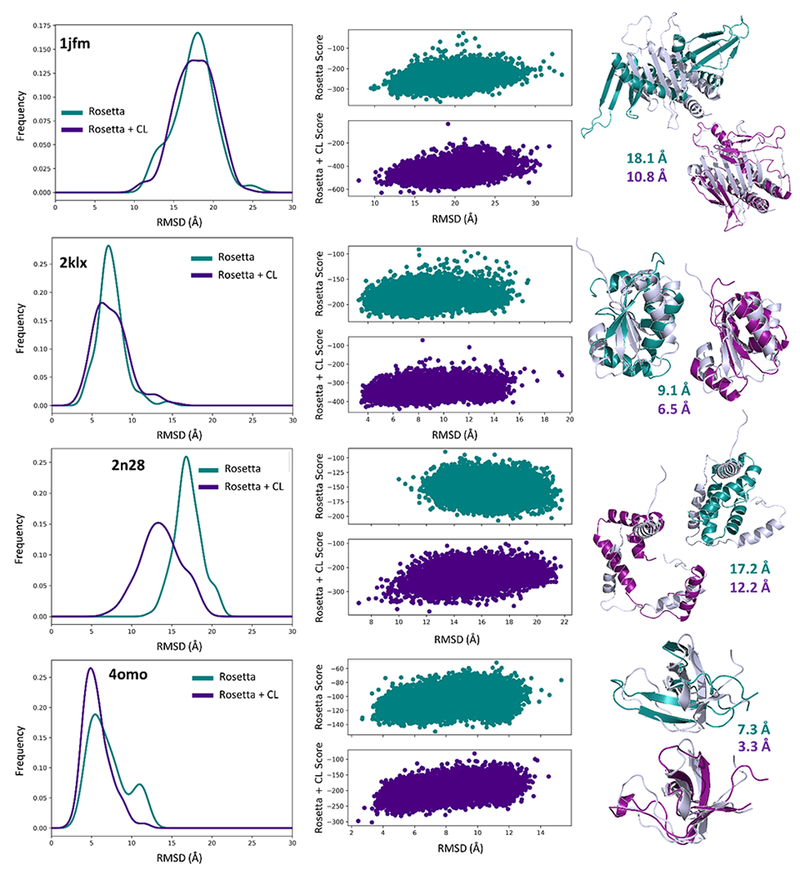
Figure 6.

Distributions of the top 1% of scoring models (150 total) with (indigo) and without (teal) covalent labeling (“all” residue type set) for 1jfm, 2klx, 2n28, and 4omo. Also plotted are the Rosetta score versus RMSD to native distributions as well as the top scoring models (colored) compared to the native (gray).
