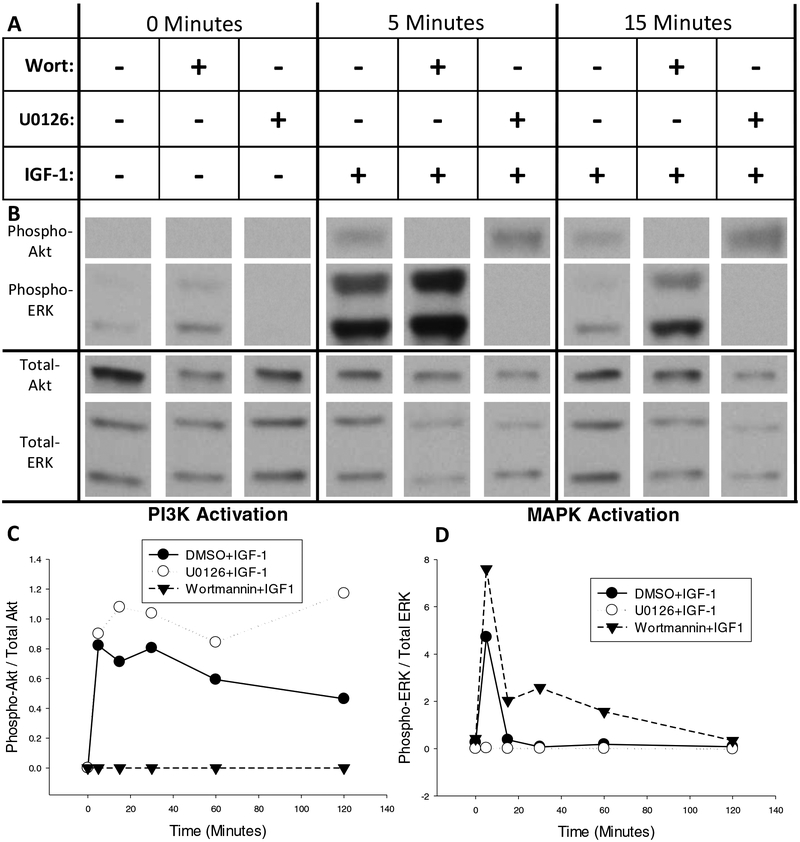
Figure 3.
Time-course of MAPK and PI3K activation after treatment with IGF-1 as determined by phosphorylation of ERK and Akt, respectively. (A) Neuro-2A cultures were pretreated for 45 minutes with the PI3K inhibitor, wortmannin, the MAPK inhibitor, U0126, or vehicle alone (0.43% DMSO). Cells were then treated for zero, five, 15, 30, 60, or 120 minutes with 100nM IGF-1. (B) Representative western blots of phosphorylated and total Akt and ERK after zero, five, or 15 minutes of IGF-1 treatment that were developed with low-sensitivity chemiluminescent substrate. (C) Quantification of Akt and (D) quantification of ERK phosphorylation over time after activation of IGF-1. + addition of drug, - omission of drug.

