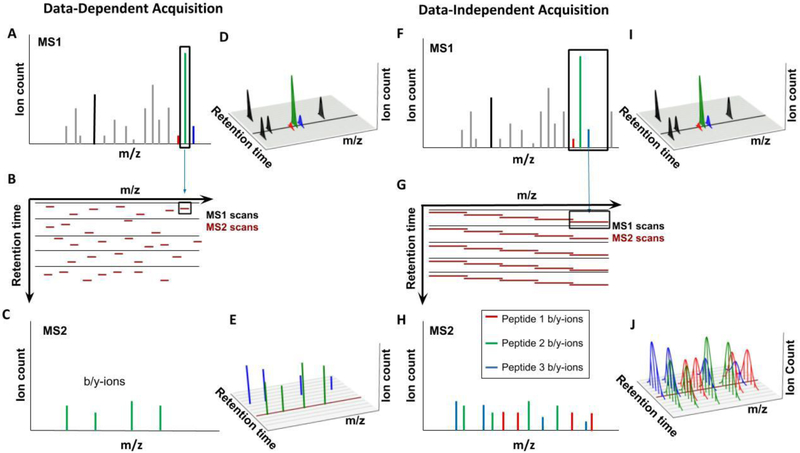
Figure 3: Comparison of Data-Dependent and Data-Independent Acquisition approaches.
A-E) Data-Dependent Acquisition (DDA). A) The goal of DDA is to identify as many peptides as possible, one at a time. The highest peaks in the MS1 spectrum are selected for isolation, with an isolation window of ~1 Th. Peptides in this window are isolated and fragmented for readout in the MS2 spectra. B) Shown is the sequence of MS1 spectra (black) and the data-dependent MS2 isolation windows (dark red), centered on the highest abundant peaks. Each MS1 is followed by multiple MS2 spectra - with current instrumentation and duty cycles of ~2 seconds this would be ~30 MS2 spectra following each MS1 spectrum. C) The MS2 spectrum resulting after isolation and fragmentation consists mainly of b- and y-ions from the target peptide, which allows for comparatively simple peptide identification. D) For quantification, e.g., with label-free approaches, the peptides in the MS1 spectrum are continuously monitored via the peak intensities in the MS1 spectra. Shown are the retention profiles for various peptides - the area under this curve is typically used for peptide quantification. The black line represents the single MS1 scan shown in B. E) Shown here are peaks for the b- and y-ions for the green and blue peptide. A peptide is typically only isolated once for MS2 analysis, the peak height cannot be used for quantification. Not all peaks in the MS1 will trigger the collection of an MS2 spectrum (peaks for the red peptide are missing). Additionally, low-abundance peaks might be below the detection limit in the MS1 spectrum and thus cannot trigger MS2 spectra. The dark red line represents the single MS2 scan shown in C. F-J) Data-Independent Acquisition (DIA). F) The goal of DIA is to continuously collect fragment ion intensities for all eluting peptides. To make this approach compatible with current MS speed requires significantly wider isolation windows (~10 Th) compared to the DDA approach (~1 Th). All the ions within this comparatively wide isolation window are isolated and simultaneously fragmented. G) Shown is the schedule of MS1 spectra (black) and the isolation windows of MS2 spectra (red). H) The simultaneous isolation and fragmentation of multiple peptides results in a complex MS2 spectrum consisting of b- and y-ions from all isolated peptides. I) Similarly to DDA, MS1 intensities of peptides are collected and can be used for quantification. The black line indicates the time for the MS1 spectrum in G. J) Unlike in the DDA equivalent, ion intensity information for b- and y-ions are available throughout the entire elution profile for each peptide. This makes it possible to use fragment ion intensities for quantification. Because the entire m/z space is continuously covered, information for more peptides than with the DDA approach is available. Here, the red peptide’s abundance can be quantified. The dark red line represents the single MS2 scan shown in H

