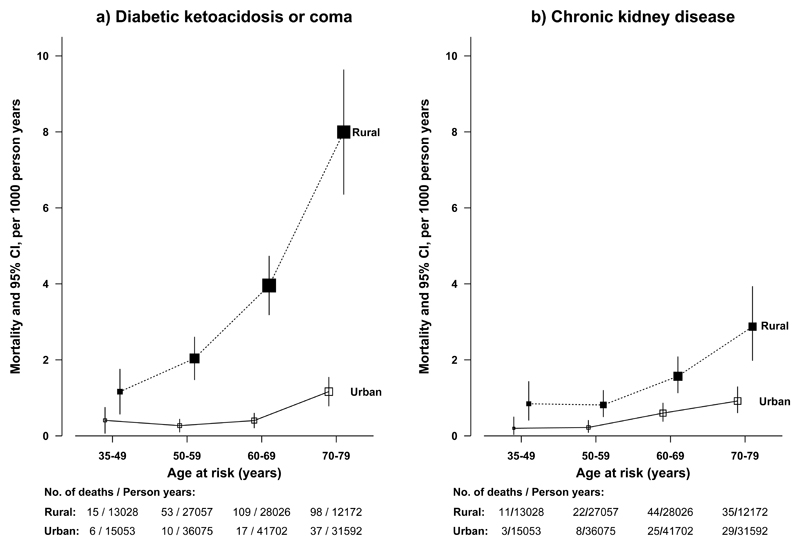
Figure 2. Rural and urban mortality rates of diabetic ketoacidosis or coma (definite or probable) and chronic kidney disease among people with diabetes by age at risk.
The death rates by four age-at-risk groups (35-49, 50-59, 60-69 and 70-79) were standardized for sex, using the total diabetic population in CKB as the standard. The age at risk was calculated according to baseline age and length of follow-up, with censoring date by 1.1.2014 or age of death if earlier. The analyses were restricted to those who died at age-at-risk 35-79 years, excluding 0 deaths at age-at-risk <35 and 5 and 8 deaths at age-at-risk ≥80 years for diabetic ketoacidosis or coma and chronic kidney disease, respectively. The point estimates on the x-axis for both panels represent the rates for each age category, with number of deaths and person-years shown underneath the x-axis. The size of each box is proportional to the number of deaths in each group and the error bars indicate the 95%CI. To avoid overlap of 95%CI lines, the boxes and their 95% CIs for rural and urban areas were moved apart slightly from the actual positions.

