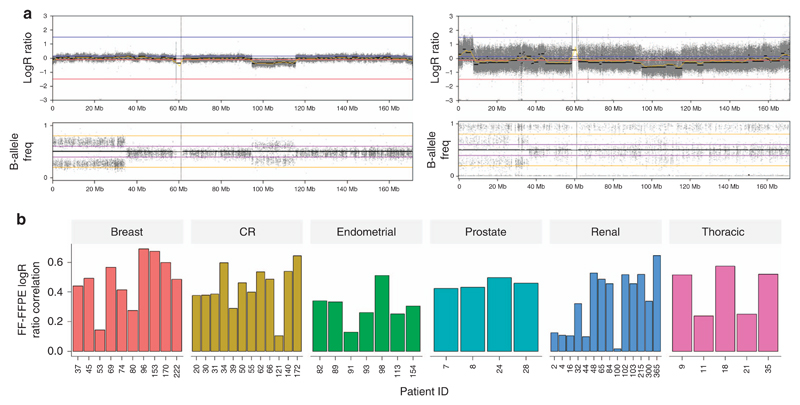
Figure 3. Somatic CNA detection.
(a) Detection illustrated by a representative example of the chromosome view in Nexus Copy Number showing CNAs across chromosome 6 for case 039 in the FF sample and FFPE sample. Log2 ratio (LogR) shows increase in intensity for genome amplifications and decrease in intensity for deletions, and the corresponding B-allele frequency plots show variation of the median signal for loss of heterozygosity. For each of the two samples, the top panel represents the Log2 ratio and the bottom panel shows the B-allele frequency. (b) Distribution of Spearman correlation coefficient of FF Log2R and FFPE Log2R showing the agreement between FF and FFPE. A high correlation coefficient represents a high agreement between FF and FFPE samples to differentiate change in copy-number intensity signal. B-allele freq, B-allele frequency; CNA, copy-number alteration; CR, colorectal; FF, fresh-frozen sample; FFPE: formalin-fixed, paraffin-embedded sample; Log2R, Log2 ratio.

