
Figure 5.
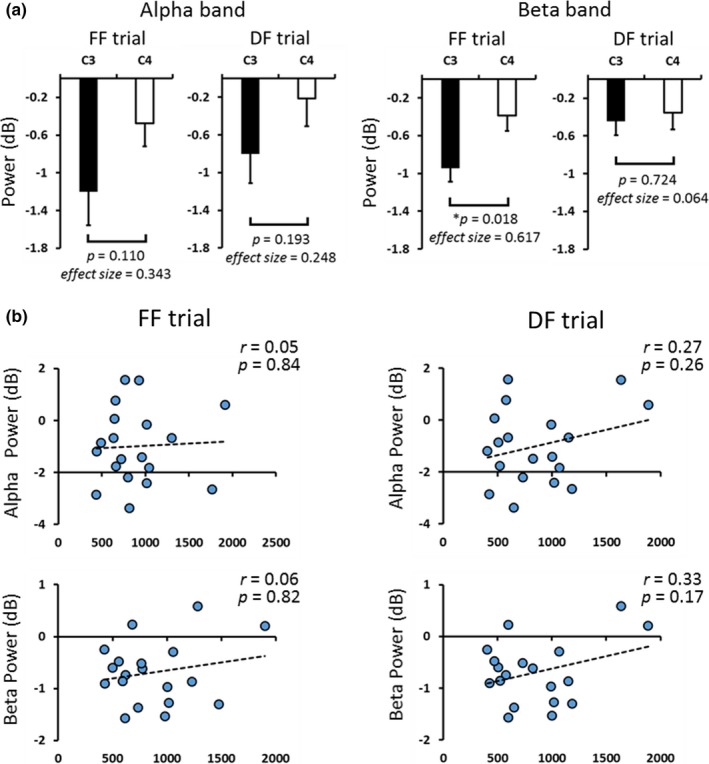
(a) ERDs on C3 and C4 areas at 0–500 ms after the presentation of food stimulus. In FF trial, ERDs in the beta band on C3 were significantly stronger than those on C4 (Student’s t test, p = 0.018). (b) Scatter diagrams showing ERDs on C3 areas at 0–500 ms and response time during FF and DF trials. There were no relationships between ERDs and response time (Pearson's correlation test, alpha: FF, p = 0.84, DF, p = 0.26; beta: FF, p = 0.82, DF, p = 0.17)