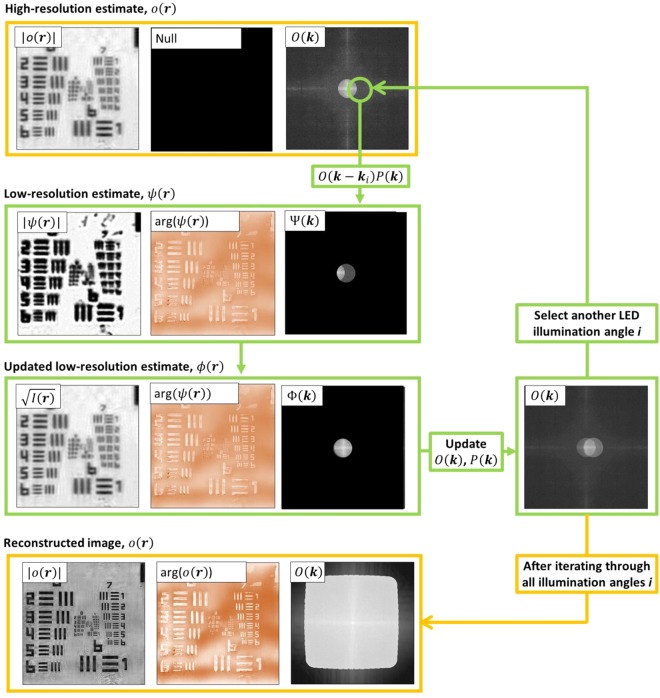
Figure 5.
Diagram of a single FPM reconstruction algorithm iteration n. It starts by initializing a high-resolution image estimate o0(r), which was an interpolated experimental brightfield image. For each illumination angle, a region of the high-resolution estimate spectrum, corresponding to illumination angle i is low-pass filtered to produce an estimate of the low-resolution image: . A new estimate, is obtained by replacing the amplitude of with the amplitude of the demosaiced recorded image, , while retaining the phase of . The low-resolution spectrum is added into the high-resolution spectrum using eqs (6) and (7) to yield the updated object spectrum and pupil functions On+1(k) and Pn+1(k). The whole process continues till spectrum regions corresponding to all illumination angles are updated. An example of the reconstructed spectrum is shown at the bottom of the figure.

