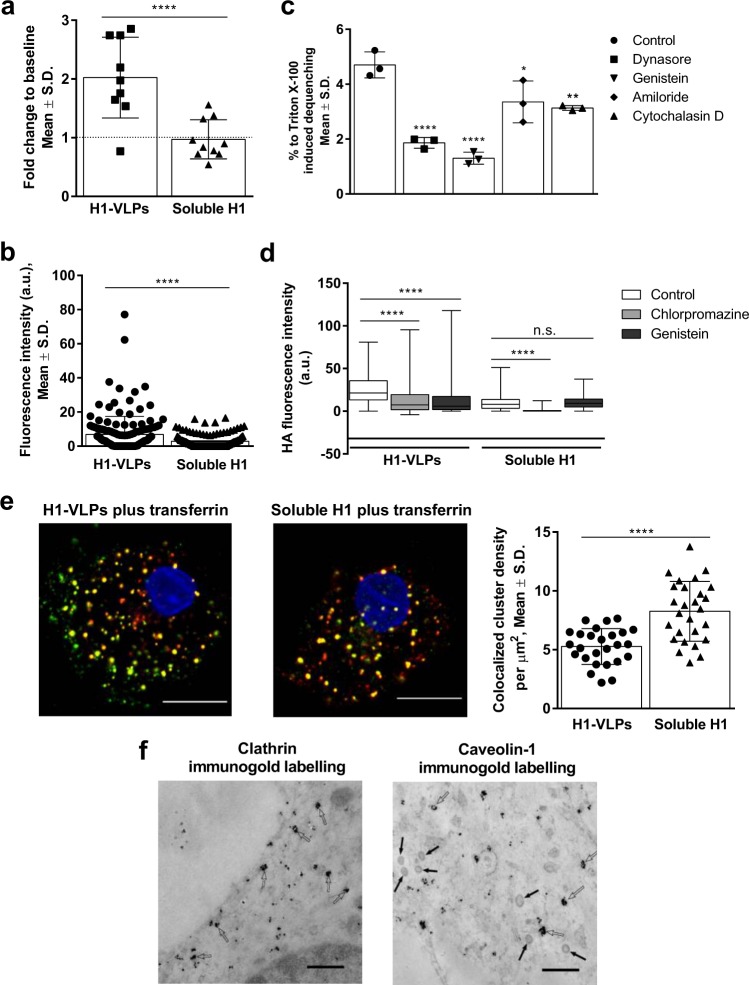
Fig. 2.
Mechanisms of H1-VLPs and soluble H1 internalization by human MDMs. a Number of endocytic vesicles in MDMs exposed to H1-VLPs or soluble H1 for 5 min, normalized against the baseline count (taken as 1, dotted line). Data from two experiments were analyzed. b HA internalization by MDMs exposed to either H1-VLPs or soluble H1 for 15 min. The amount of internalized protein was evaluated by the intensity of HA immunofluorescence per cell area on confocal microscopy images. Based on 4 experiments. c Effect of endocytosis inhibitors on DiD dequenching by MDMs loaded with DiD-labeled H1-VLPs (at 2 h). Data from 3 experiments were analyzed. d Effect of chlorpromazine and genistein on H1-VLPs or soluble H1 internalization by MDMs upon 15 min of exposure. The amount of internalized protein evaluated by the intensity of HA immunofluorescence per cell area on confocal microscopy images. Based on 6 experiments. e Colocalization of HA and transferrin in MDMs exposed to H1-VLPs and transferrin (left) or soluble H1 and transferrin (center), and segmentation ICCS colocalization (number of colocalized particles per µm2—right). Representative images from 3 experiments shown. Scale bar–10 µm. Green: fluorescently labeled HA, red: transferrin conjugated with CF568 fluorophore (yellow shows colocalization of two proteins), blue: nuclei stained with DAPI. f Representative TEM image with nanogold immunolabeled clathrin (left). Open arrows indicate clathrin-coated endocytic vesicles. Representative TEM image with nanogold immunolabeled caveolin-1 (right). Open arrows indicate caveolin-coated endocytic vesicles. Solid arrows indicate unlabeled clathrin-coated endocytic vesicles with typical clathrin spikes. Scale bar–500 nm. Bar graphs present mean ± standard deviation (S.D.); box and whisker plot presents the minimum, maximum, median, and 25th and 75th percentiles. *p < 0.05, **p < 0.01, ****p < 0.0001. n.s.: nonsignificant (a, c, d—one-way ANOVA followed by Tukey’s multiple comparisons post-test; b, e—Mann–Whitney test)

