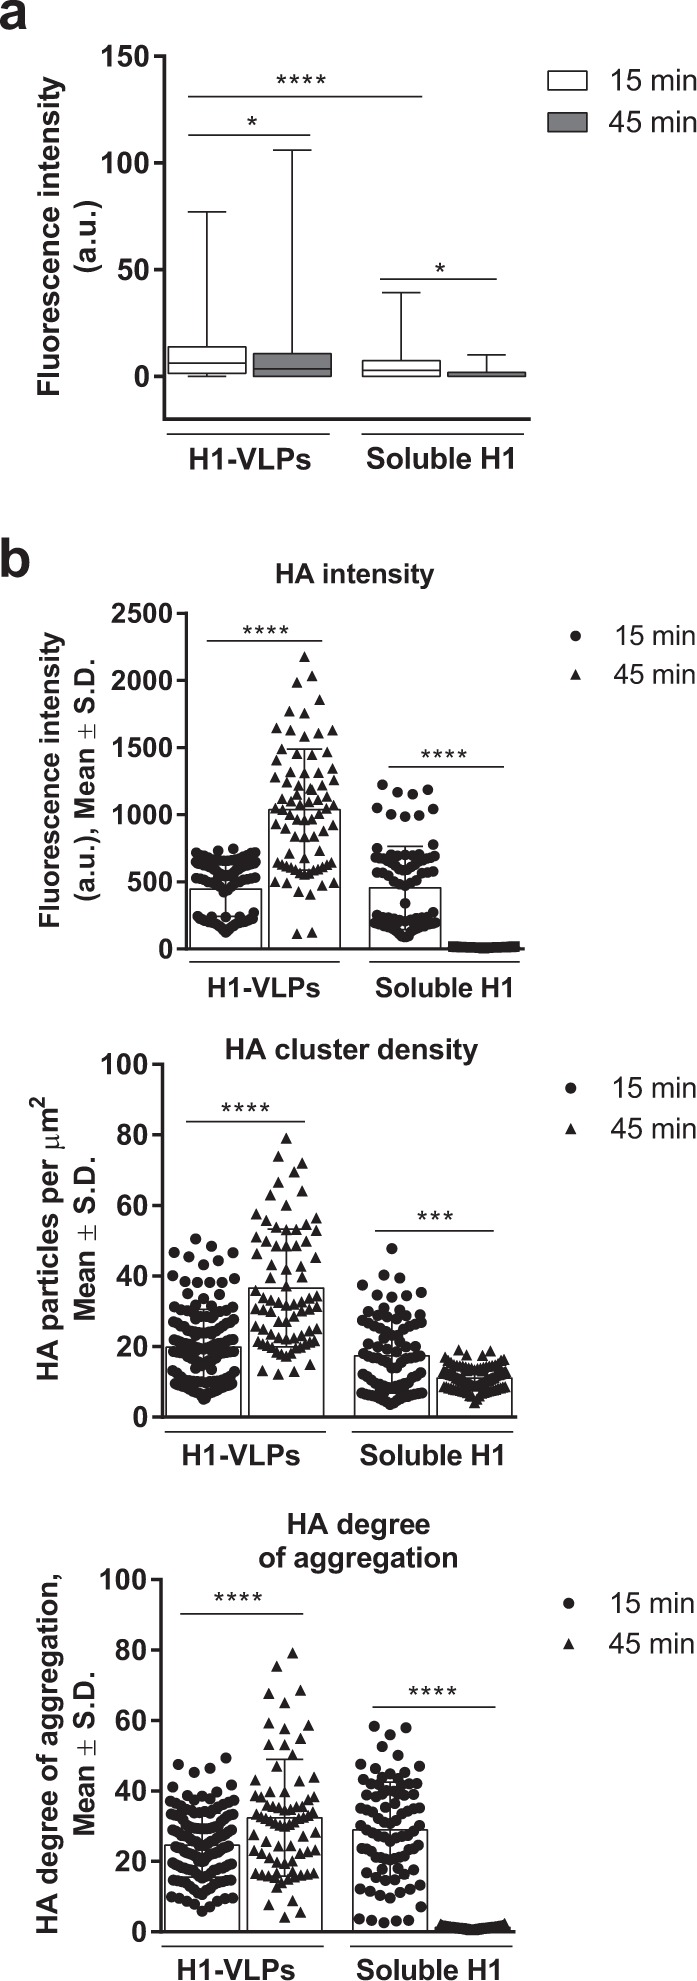
Fig. 3.

Intracellular HA distribution in human MDMs exposed to H1-VLPs or soluble H1. a HA internalization and degradation by MDMs pulsed with either H1-VLPs or soluble H1. The amount of internalized protein evaluated by the intensity of HA immunofluorescence per cell area on confocal microscopy images. Data from 9 experiments were analyzed. b Segmentation ICCS analysis of the HA endosomal distribution in MDMs pulsed (15 min) with either H1-VLPs or soluble H1 shows HA fluorescence intensity (top), cluster density (number of fluorescent particles per µm2—middle) and degree of HA aggregation (bottom). Based on 7 experiments. Bar graphs present mean ± standard deviation (S.D.); box and whisker plot presents the minimum, maximum, median, and 25th and 75th percentiles. *p < 0.05, ***p < 0.001, ****p < 0.0001 (one-way ANOVA followed by Tukey’s multiple comparisons post-test)
