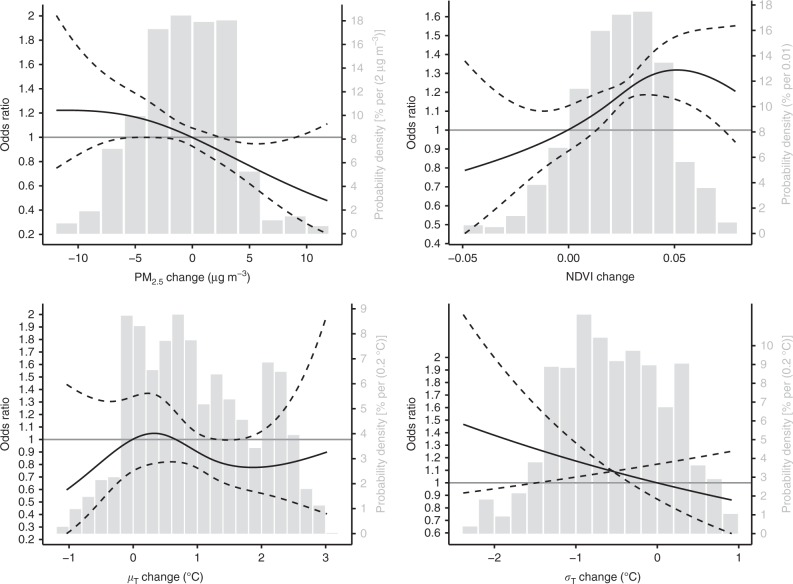
Fig. 1.
Exposure–response curves. The curves (the solid lines) with 95% confidence intervals (dashed lines) are estimated by the fully adjusted nonlinear effect models. The covariates include changes in alcohol consumption, education, migration, obesity, physical activity, and smoking status, as well as baseline age, alcohol consumption, education, diet type, gender, income, marital status, nationality, physical activity status, obesity status, area of residence, and smoking status in 2013. The histograms (gray bars) present the distributions of the environmental changes among the studied adults. For the exposure–response curves, please refer to the left y-axis; for the distributions, please refer to right y-axis

