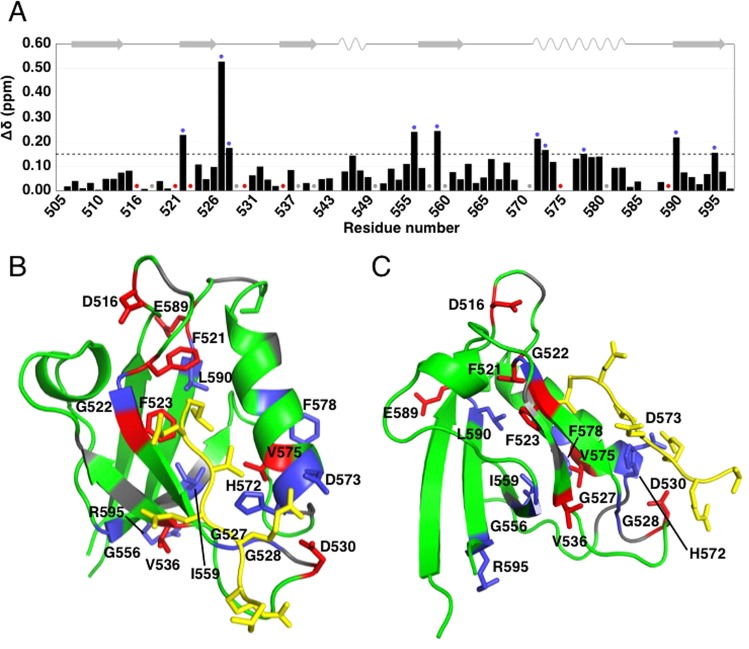
Figure 5.
Δδ between free PTPN3-PDZ and PTPN3-PDZ bound to HPV16E6 PBM. (A) Δδ values (1H, 15N) computed as ∆δ = [(∆δH)2 + (∆δN*0.15)2]1/2. The dashed black line represents the threshold used to determine the perturbed region with ∆δ > 0.15 ppm; blue circles mark residues perturbed with ∆δ > 0.15 ppm; red circles mark residues with no resonance in free PTPN3-PDZ; grey circles mark residues whose behavior could not be safely defined, mainly because they fall in crowded spectral regions. (B) Two views of the structure of PTPN3-PDZ bound to HPV16E6 PBM (PDB ID 6HKS) with different colors depending on Δδ values. Blue: ∆δ > 0.15 ppm; red: resonances absent from the free PTPN3-PDZ spectrum; grey: residues whose resonances fall in crowded spectral regions. HPV16E6 PBM peptide is represented in yellow. Side chains of affected residues are represented as sticks.

