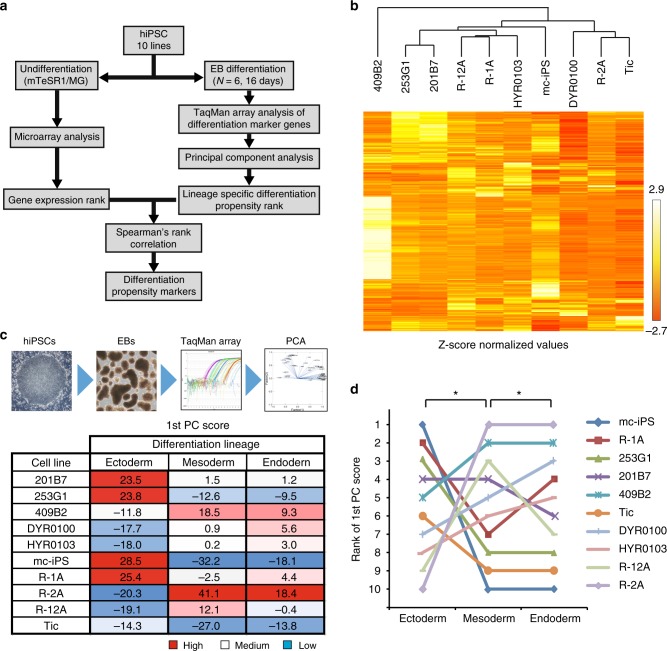
Fig. 1.
Profiles of hiPSC lines showing differentiation propensities. a Outline of workflow for identification of biomarkers capable of predicting the differentiation propensity of hiPSCs. b Hierarchical clustering of gene expression in ten hiPSC lines. We identified 3362 probes with significantly different expression levels among ten hiPSC lines. c Expression profiles for lineage marker genes were summarized using PCA. The number indicates PC1 of each lineage among the ten hiPSC lines. d The line graph represents the rank of the first PC score of each lineage among the ten hiPSC lines. *P < 0.05, Spearman’s rank correlation coefficients

