Fig. 4.
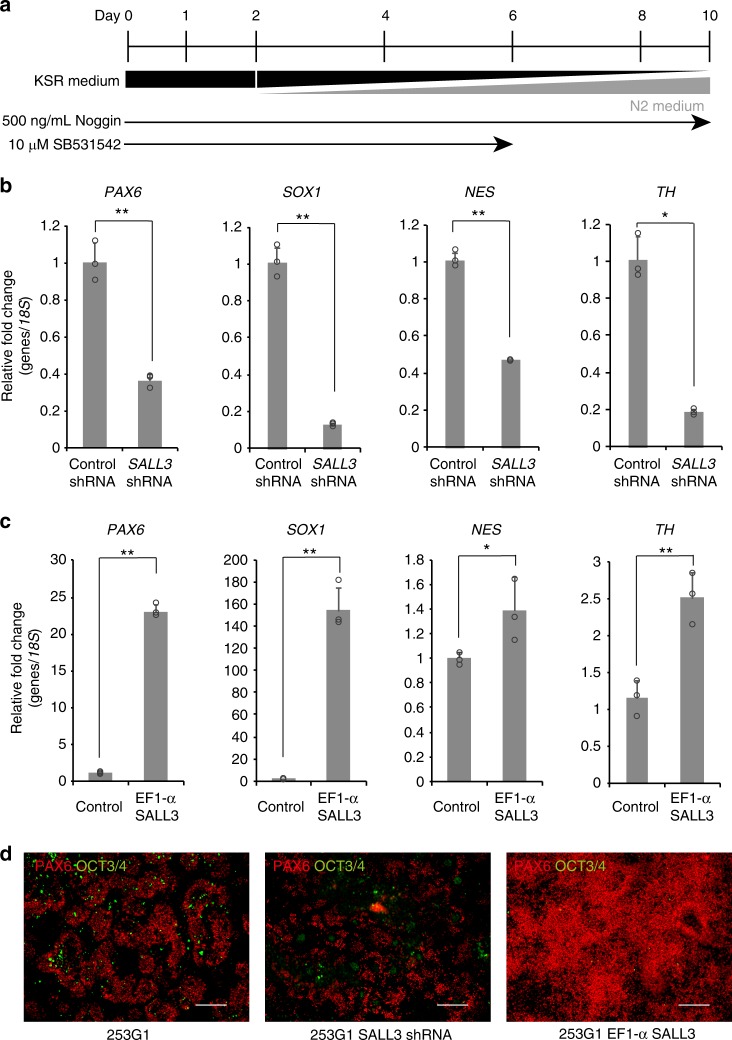
SALL3 expression regulates neural differentiation. a Schematic diagram of culture procedures for neural cells. b, c qRT-PCR analysis of neural cell markers PAX6, SOX1, NES, and TH. Total RNA from 253G1 SALL3 shRNA cell-derived and 253G1 control shRNA cell-derived neural cells (b) and 253G1 EF1α-SALL3 cell-derived and 253G1 control vector cell-derived neural cells (c) was isolated (n = 3, biological replicates). *P < 0.05, **P < 0.01, two-sided t test. d Immunofluorescence staining of PAX6 and OCT3/4 in 253G1 cell-derived (left), 253G1 SALL3 shRNA cell-derived (center), and 253G1 EF1α-SALL3 cell-derived neural cells (right). Scale bars, 200 µm. Error bars represent mean ± SD

