Fig. 6.
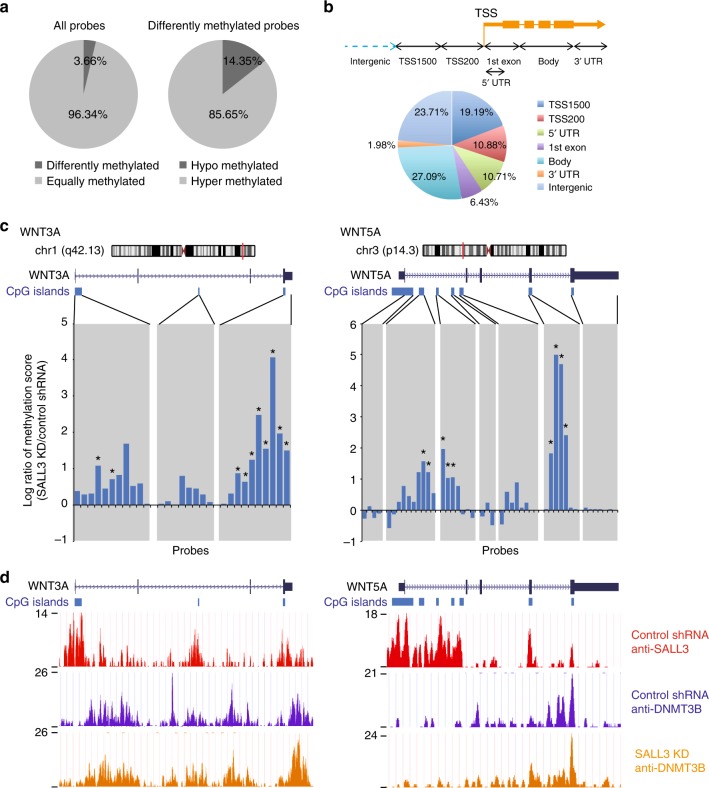
SALL3 regulates gene-body DNA methylation. a HumanMethylation450K BeadChip analysis of 253G1 SALL3 shRNA cells and 253G1 control shRNA cells. Diagram shows a comparison of the similarly methylated and differentially methylated probes (left) and hypermethylated and hypomethylated probes in 253G1 SALL3 shRNA cells, compared to the control cells (right). b Distribution of hypermethylated regions. Top: schematic showing the seven categories. Bottom: pie chart showing the percent distribution of hypermethylated probes in each category. c HumanMethylation450K BeadChip analysis of the WNT3A locus (left) and WNT5A locus (right). Top: schematic of a gene locus on the chromosome. Middle: schematic of a CpG island locus in two genes depicted by the UCSC Genome Browser. Bottom: methylation score. Gray vertical bars highlight CpG island and shore regions (n = 3, biological replicates). Asterisks highlight probes with a significant difference in the methylation score between the control and SALL3 knockdown (P < 0.05, two-sided t test). d The ChIP-seq data of the WNT3A locus (left) and WNT5A locus (right) are depicted by the UCSC Genome Browser. Top track: SALL3 protein binding to genomic regions in 253G1 control shRNA cells. Middle and bottom tracks: DNMT3B protein binding to genomic regions in 253G1 control shRNA cells and 253G1 SALL3 shRNA cells

