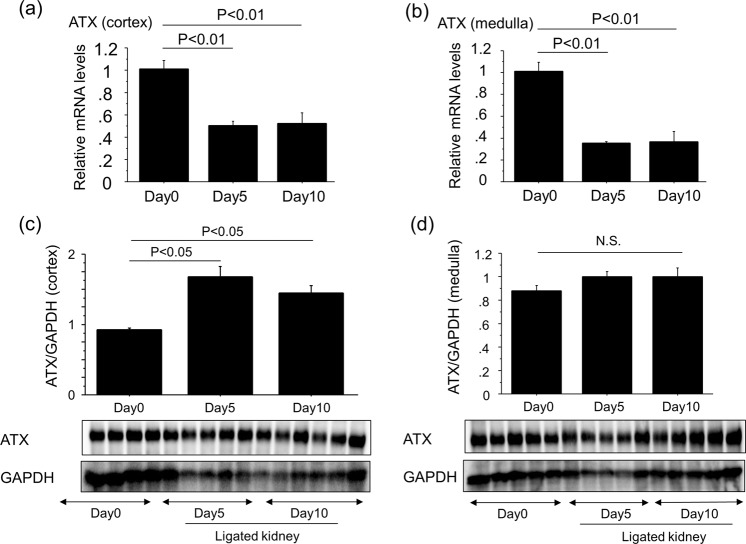
Figure 3.
ATX protein levels in the cortex of ligated kidneys increase with the progression of renal interstitial fibrosis. (a,b) Relative mRNA levels of ATX in kidneys obtained from cortex (a) and medulla (b) at day 0, 5 and 10 post-UUO (n = 5 mice/group). ΔΔCT method was used to calculate relative gene expression of ATX with GAPDH being the internal control. Data are expressed as mean ± SEM. (c,d) The expression of ATX protein in kidney lysates obtained from cortex (c) and medulla (d) at day 0, 5 and 10 post-UUO. Quantification was performed with Image J software and data are expressed as mean dots of ATX bands relative to dots of GAPDH bands ± SEM (n = 5 mice/group).

