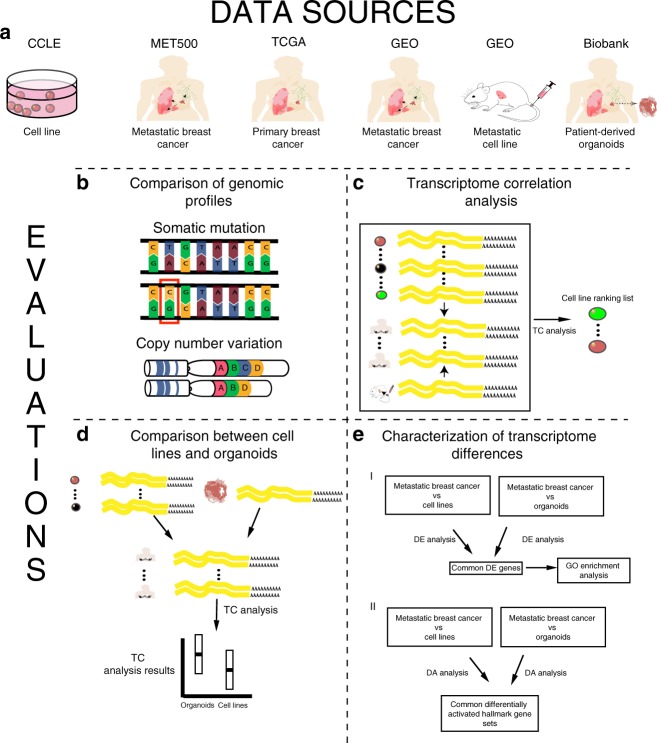
Fig. 1.
Overall research design. a Data sources and sample types used in this study. b–e Evaluations performed in this study: b comparison of genomic profiles, c transcriptome correlation analysis, d comparison between cell lines and organoids, and e characterization of transcriptome differences. TC analysis: transcriptome correlation analysis; DE analysis: differential gene expression analysis; DA analysis: gene set differential activity analysis

