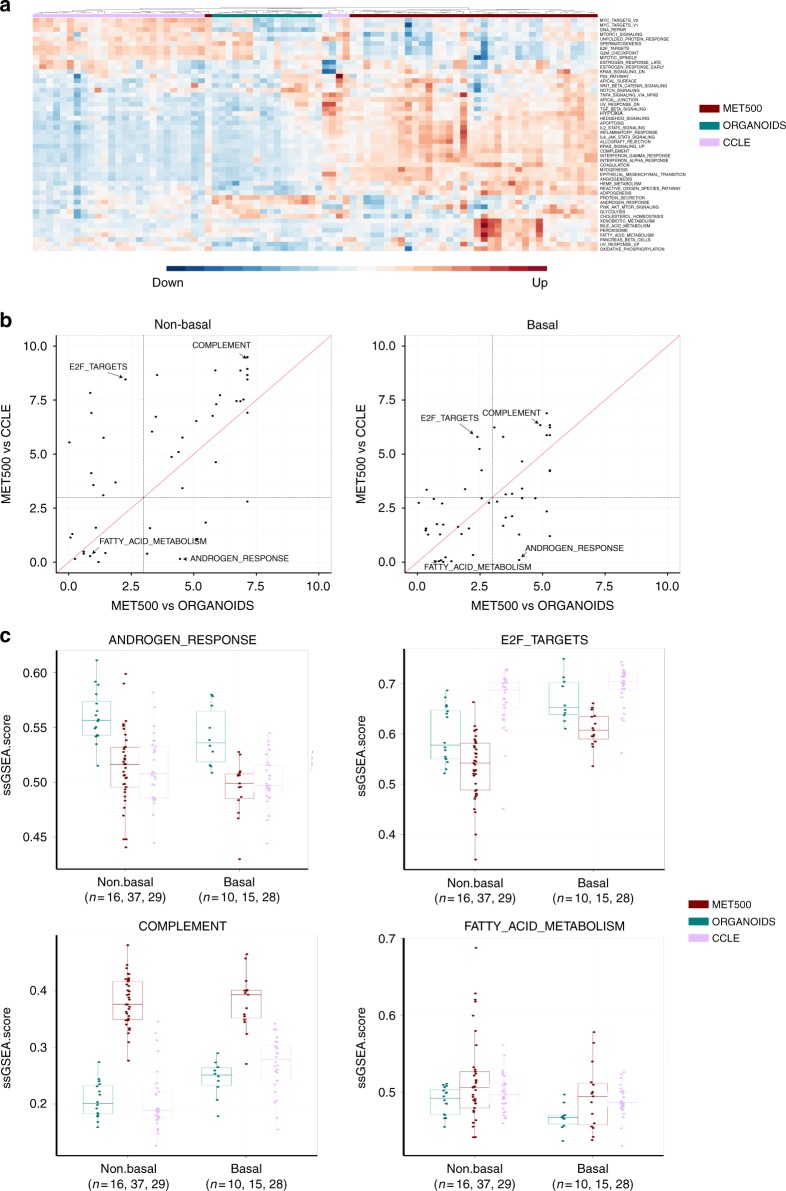
Fig. 6.
Comparison of ssGSEA scores of the 50 MSigDB hallmark gene sets. a Visualization of ssGSEA scores across non-Basal-like CCLE breast cancer cell lines, MET500 breast cancer samples, and organoids. b DA analysis results of different breast cancer subtypes. Each dot is a hallmark gene set, with the x-axis representing −log10(FDR) derived from MET500-vs-organoids comparison, and the y-axis representing −log10(FDR) derived from MET500-vs-CCLE comparison. c Boxplot of ssGSEA scores of the four representative gene sets. In each box, the central line represents the median value and the bounds represent the 25th and 75th percentiles (interquartile range). The whiskers encompass 1.5 times the interquartile range. Source data are provided as a Source Data file

