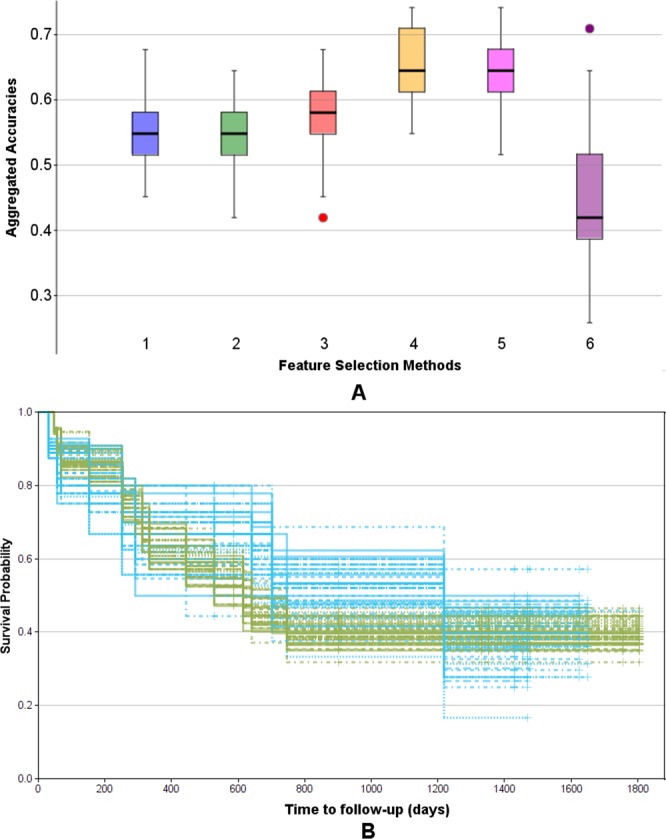
Figure 10.

Evaluation of feature selection methods using the Monte Carlo cross validation (M = 50) for IPI response prediction. (A) Comparison of methods regarding their aggregated uni-variate stratification performance: (1) Stratification on whole data set (blue), (2) bootstrapping (green), (3) leave-one-out cross validation (red), (4) 10-times repeated 8-fold cross validation (yellow), (5) 10-times repeated 5-fold cross validation (magenta), (6) 10-times repeated 5-fold cross validation using the log-rank test p-value as objective function (violet). (B) Aggregated Kaplan-Meier plot (with respect to OS and stratification according to predicted IPI response) for the feature selection method (4) 10-times repeated 8-fold cross validation, yielding the highest accuracy. Blue: predicted response, green: predicted non-response.
