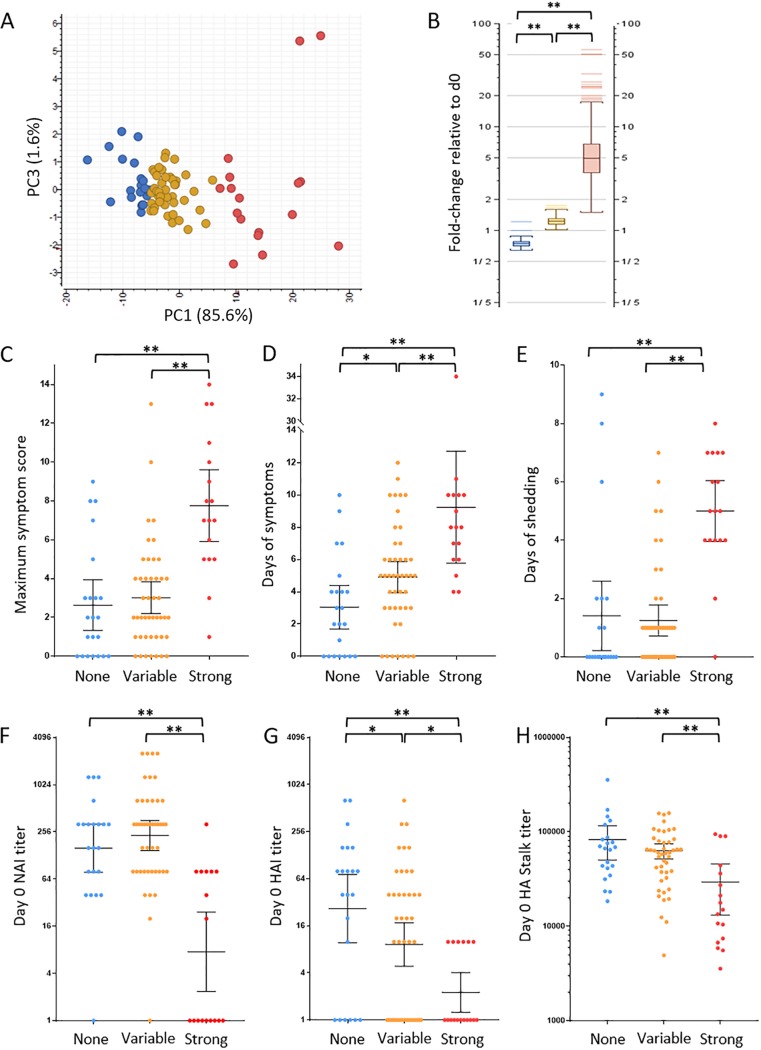
FIG 3.
Logistic regression determined differential PBL gene expression correlated with viral shedding. (A) Principal-component analysis of participant PBL expression of viral shedding-associated genes identified by logistic regression at 42 h postchallenge. The response group was determined by k-means analysis: no response (blue), strong response (red), and variable response (yellow). (B) Graph of response group average gene expression at 42 h genes relative to day 0. (C to E) Statistical analysis of clinical illness, including maximum symptom score (C), days of symptoms (D), and days of viral shedding (E) between the 42 h PBL expression response groups. (F to H) Statistical analysis of preexisting antibodies between the three PBL response groups at 42 h postinfection as measured by day 0 NAI titer (F), HAI titer (G), and HA stalk ELISA titer (H). For NAI and HAI titers, the geometric mean titer (GMT) is shown with 95% confidence intervals, while HA stalk titer is shown as median with 95% confidence intervals. Statistical significance between groups was assessed using rank sum t test and indicated as follows: *, P ≤ 0.05; **, P < 0.01.

