
Figure 5.
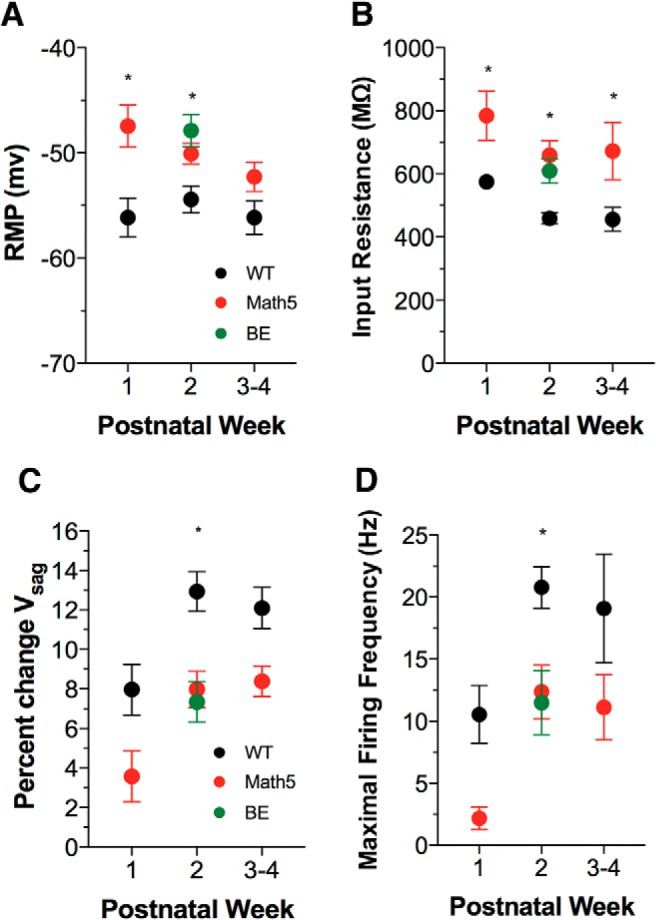
Passive and active membrane properties of dLGN interneurons in WT, math5−/−, and BE interneurons. A–D, Summary plots displaying age-related changes in resting membrane potential (A), input resistance (B), IH amplitude (C), and firing frequency (D) of interneurons in WT (black), math5−/− (red), and BE (green) mice. Each point represents mean values ± SEM arranged by postnatal week. A, math5−/− and BE interneurons exhibit more depolarized RMPs than WT (*math5−/−: week 1, p = 0.003; week 2, p = 0.035; BE: week 2, p = 0.003). B, math5−/− and BE interneurons have a higher input resistance than WT interneurons (*math5−/−: week 1, p = 0.038; week 2, p = 0.013; weeks 3–4, p = 0.027; BE: p = 0.042). C, WT interneurons show an increase in Vsag between weeks 1 and 2 (*p = 0.029), whereas math5−/− and BE interneurons are decreased compared with WT interneurons (*math5−/−: week 2, p = 0.002; BE: p < 0.001). D, In WT mice, interneurons experience a twofold increase in frequency between weeks 1 and 2 (*p = 0.005). Between weeks 1 and 2, math5−/− interneurons also show increases in frequency (*p = 0.0006), but both math5−/− and BE interneurons remain lower compared with WT interneurons (*math5−/−: week 2, p = 0.015; BE: week 2, p = 0.009). The numbers of cells are the same as in Figure 3.