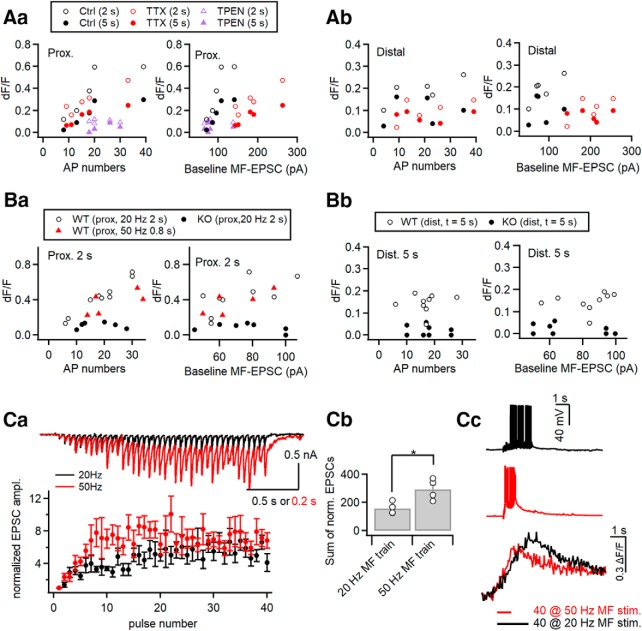
Figure 10.
MF input-induced proximal dendritic [Zn2+] elevation linearly depends on the number of postsynaptic APs. A, MF stimulation-induced ΔF/F0 values measured at 2 s (open symbols) and 5 s (filled symbols) as a function of the number of postsynaptic APs and baseline MF-EPSC amplitudes. In each panel, ΔF/F0 values are compared for the control (black), 10 nm TTX (red), and TPEN (purple) conditions. All data are obtained from the same cells of Figure 9C. B, MF stimulation-induced ΔF/F0 values at proximal (25 μm from soma; Ba) and distal (>200 μm; Bb) dendrites of CA3-PCs from WT (open symbols) and ZnT3KO (filled symbols) mice as a function of the number of postsynaptic APs and baseline MF-EPSC amplitudes. All data were obtained from the same cells seen in Figure 9B, except for red symbols, which represent peak ΔF/F0 at proximal dendrites evoked by 50 Hz MF stimulation with the same pulse number in WT CA3-PCs. For proximal and distal dendrites, ΔF/F0 values were measured at 2 and 5 s, respectively. Ca, Top, Representative EPSC traces in mouse CA3-PCs evoked by MF stimulations at 20 Hz (black) and 50 Hz (red). Bottom, Mean values for MF-EPSC amplitudes normalized to the baseline as a function of pulse number. Cb, Sum of normalized EPSC amplitudes evoked by 40 pulses at 20 and 50 Hz delivered to MFs. Cc, Voltage responses evoked by MF stimulation with 40 pulses at 20 Hz (black) and 50 Hz (red). Bottom, Averaged traces for FluoZin3 fluorescence changes evoked by 20 and 50 Hz (40 pulses). Horizontal bars indicate the time for MF stimulations. *p < 0.05.

