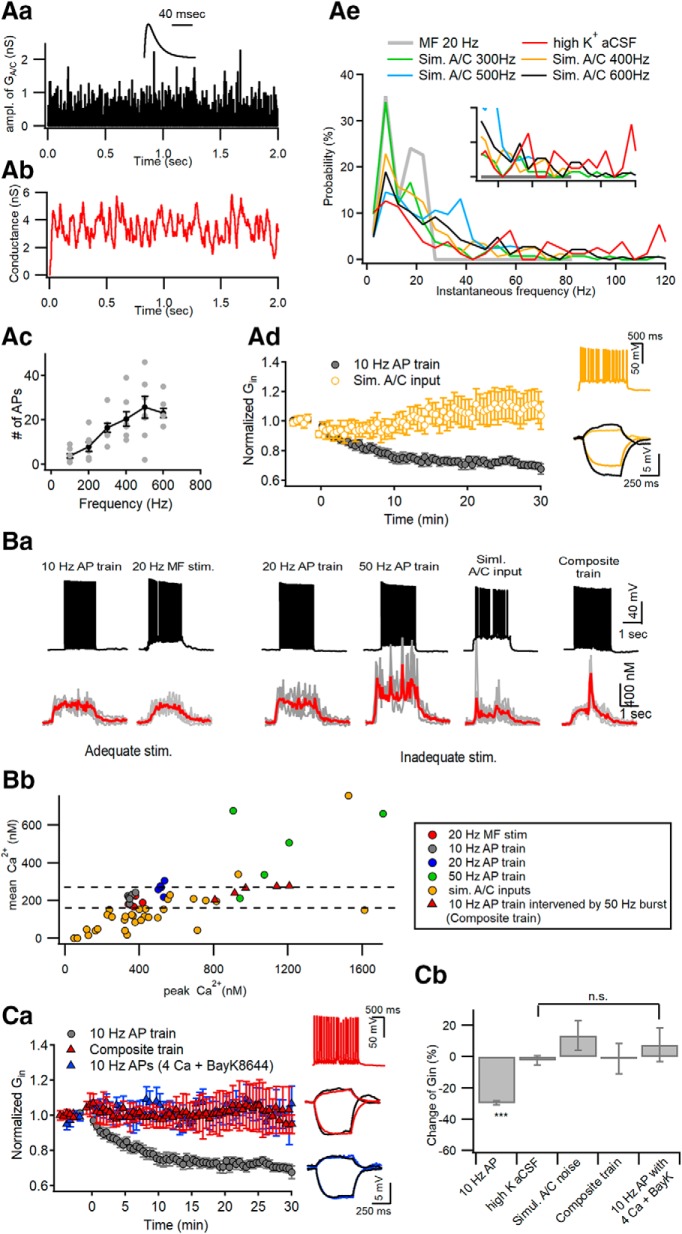
Figure 2.
Optimal [Ca2+]i window at distal apical dendrites for induction of LTP-IE. Aa, Simulation of Poisson random arrivals of A/C synaptic inputs at the mean frequency of 400 Hz. The amplitude of synaptic conductance was assumed to follow a log normal distribution with a mean and SD of 0.49 and 0.5, respectively. Inset, Template waveform of uEPSG at A/C–CA3 synapses. Ab, The conductance waveform for simulated A/C inputs, which was constructed from convolution of the events of A/C inputs with the uEPSG waveform shown in Aa. Ac, The number of APs as a function of mean frequencies of simulated A/C inputs for 2 s. Ad, Simulated A/C inputs for 2 s delivered to the soma at 0 s did not reduce Gin (yellow symbols). For comparison, Gin changes caused by somatic conditioning are plotted again from Figure 1Aa (gray). Inset, Representative AP responses to the simulated A/C inputs (top) and the subthreshold voltage responses to injection of +30 and −10 pA for 0.5 s (bottom). Ae, Probability distributions for instantaneous frequencies of APs elicited by 20 Hz MF stimulation, high-K+ aCSF, and simulated A/C inputs at 300–600 Hz. The distributions for the first two conditionings are based on data from Figure 1. Note that high-frequency AP bursts exceeding 30 Hz are generated by high-K aCSF or simulated A/C inputs, but not by 20 MF stimulation. The inset is the same plot expanded in y-axis. Ba, Somatic AP responses (top) and distal dendritic CaTs (bottom) evoked by different conditioning protocols, which are categorized by capability for the induction of LTP-IE (adequate or inadequate stimulations). In each panel of CaT, an averaged trace (red) is overlapped on raw CaTs evoked by the same stimulation protocol in different cells (gray). Composite AP train, somatic 10 Hz AP train intervened by 5 APs at 50 Hz in the middle. Bb, For all individual CaTs evoked by different stimulations, their time-averaged [Ca2+] levels are plotted as a function of their peak [Ca2+] levels. Note that CaTs evoked by adequate stimulations (gray and red filled symbols) are found within a narrow window of peak [Ca2+] levels between 338 and 378 nm, and do not overlap with CaTs induced by inadequate stimuli. Ca, To elicit excessive [Ca2+]i elevation, CA3-PCs were stimulated at 0 s with a composite AP train under standard aCSF (red triangle) or a 10 Hz AP train in the presence of extracellular 4 mm Ca2+ and 10 μm BayK8644 (blue triangle). Neither reduced the Gin of CA3-PCs, in contrast to somatic conditioning (10 Hz AP train for 2 s, gray; replotted from Fig. 1A). Insets, Representative AP responses to a composite train (top) and subthreshold voltage responses to current injection for measuring Gin (middle and bottom; black, before conditioning; color, 30 min after conditioning). Cb, Summary for mean ΔGin measured at 30 min after different conditionings. The ΔGin values for the first two conditionings (10 Hz AP train and high-K+ aCSF) are repeated from Figure 1D for statistical comparison. n.s., No statistical significance. ***p < 0.005.

