Figure 10.
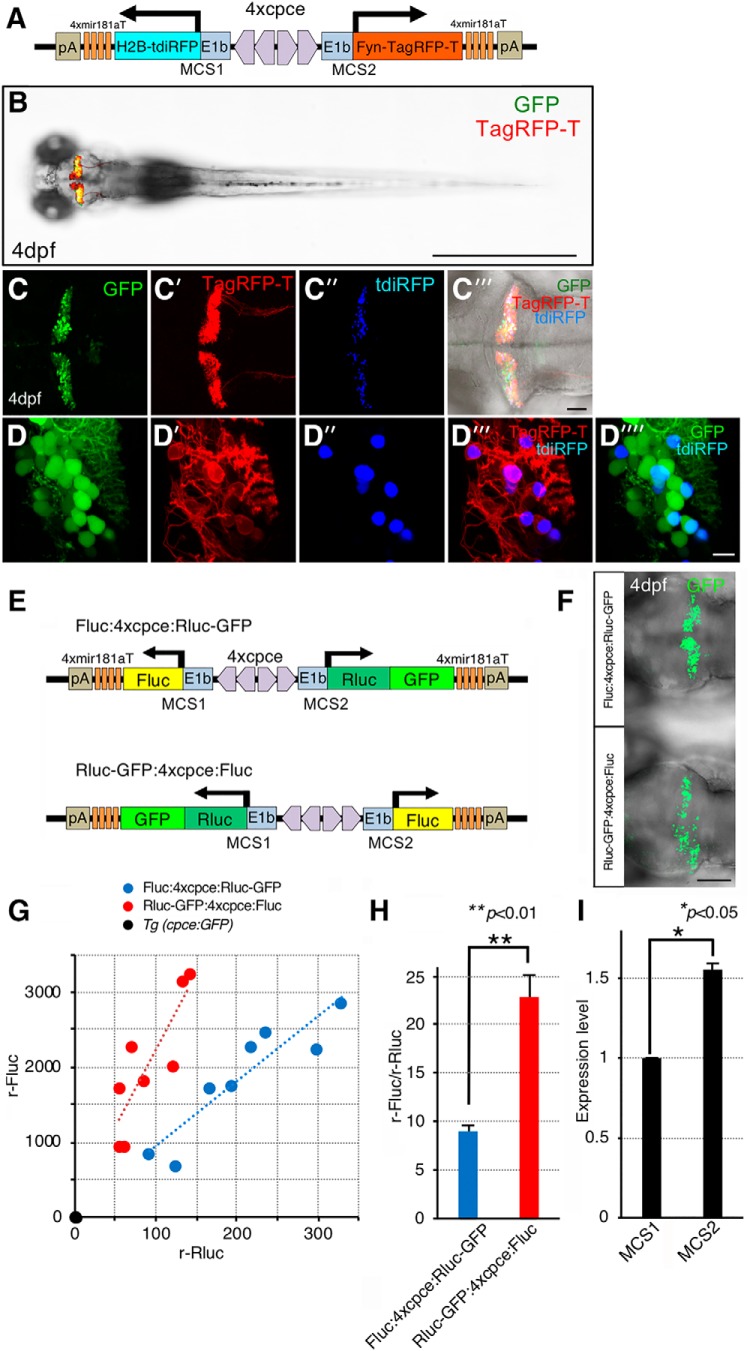
pTol2-4xcpce allows for dual subcellular reporter incorporation with slightly different expression levels in each direction. A, Schematic drawing of the construct containing two subcellular markers, membrane targeted Fyn-TagRFP-T and nuclear localized H2B-tdiRFP, which are inserted into each multiple cloning site (MCS1, or MCS2) of pTol2-cpce-MCS, respectively. This vector contains insertions of 4× mir181aT fragments immediately upstream to both pA-sequences to restrict expression of transgenes in PCs. B, Dorsal view of 4 dpf larva expressing membrane targeted Fyn-TagRFP-T (red) and GFP (green) in the cerebellum. Tg(-7.5ca8:GFP)bz12 embryos were injected with the plasmid shown in A. C–C⁗, Cerebellar overview of injected Tg(-7.5ca8:GFP)bz12 larva expressing GFP (C, green) together with Fyn-TagRFP-T (C′, red) and tdiRFP (C″, blue). C‴, A merged image of C, C″, C‴ under the bright field. D–D⁗, Higher-magnified images showing coexpression of membrane tagged Fyn-TagRFP-T (D′, D‴, red) and nuclear localized H2B-tdiRFP (blue, D″, D‴, D⁗) in PCs marked by GFP-mediated green fluorescence (D, D⁗, green). The two subcellular markers (D‴, red and blue) are coexpressed in a mosaic manner by the injected plasmid in GFP-positive PCs (D⁗). E, Schematic representations of the bidirectional 4xcpce-dual luciferase (luc) constructs expressing firefly luc (Fluc) and Renilla luc fused to GFP (Rluc-GFP), which are cloned into MCS1 and MCS2, respectively, and vice versa (Fluc:4xcpce: Rluc-GFP and Rluc-GFP:4xcpce:Fluc). Larval fish injected with either construct, showing GFP expression throughout the entire PC plate (F), were sorted for luciferase assay. G, Scatter plot depicting the values of relative Fluc (y-axis), and Rluc activity (x-axis; r-Fluc and r-Rluc, respectively) measured from a head lysate of a 4 dpf Tg(cpce-E1b:GFP) (black circle), or injected larva with Fluc:4xcpce:Rluc-GFP (blue circle) Rluc-GFP:4xcpce:Fluc (red circle), respectively, with a linear trend line (a blue or red dotted line). r-Fluc and r-Rluc for each lysate was obtained as the ratio of an obtained luciferase activity by a mean background activity in lysate from a head of a brass larva. H, The mean ratio of r-Fluc activity by r-Rluc (r-Fluc/r-Rluc) in an individual head lysate of a larva injected with each construct. N values of zebrafish in each group in G and H are 8. I, The mean value indicating expression level of a reporter gene cloned into MCS1 (Fig. 9E, facing left), or MCS2 (Fig. 9E, facing right), was calculated by the square root of the mean ratio of (r-Fluc/r-Rluc) for each group (see Materials and Methods), which were obtained from two individual experiment. p values were determined by unpaired Student's t test. H, Fluc:4xcpce:Rluc-GFP versus Rluc-GFP:4xcpce:Fluc p = 0.0036; I, MCS1 versus MCS2 p = 0.0438. Scale bars: B, 1 mm; F, 100 μm; C‴, 50 μm; D⁗, 10 μm.

