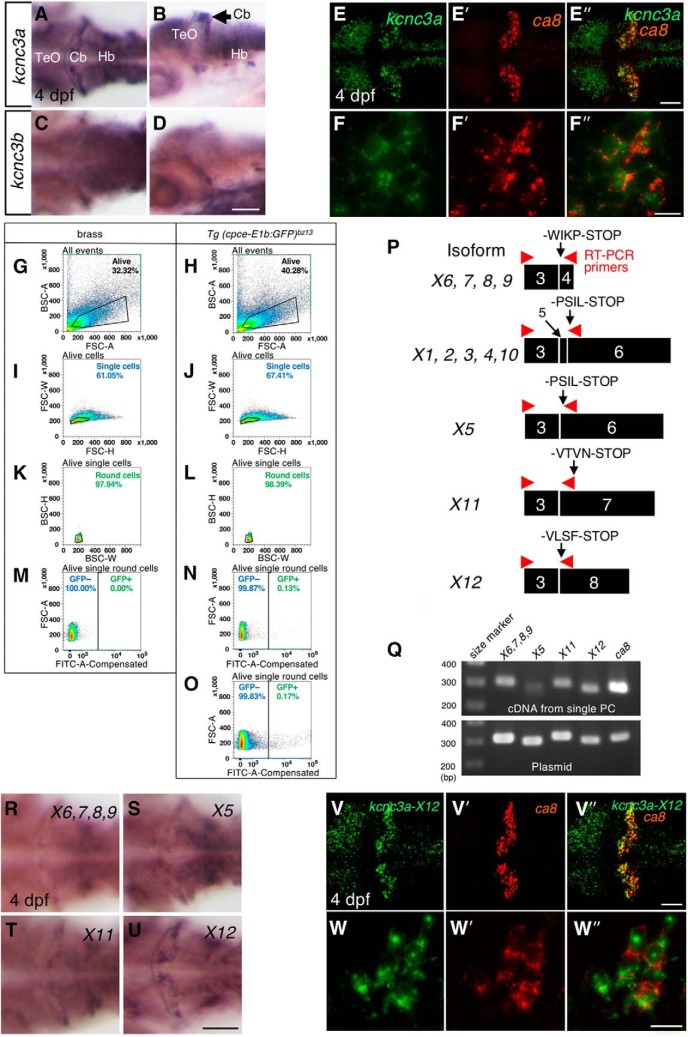
Figure 11.
Expression of kcnc3a splice isoforms in PCs. A, Whole-mount in situ hybridization of kcnc3a (A, B) or kcnc3b (C, D) in 4 dpf larvae. Dorsal (A, C) and lateral views (B, D). mRNA for kcnc3a is strongly expressed in the cerebellum reminiscent of the PC layer (A, B), whereas expression of kcnc3b is much weaker and not well confined to any cerebellar cell population (C, D). Images showing two-color fluorescent in situ hybridization of kcnc3a (E, F, green), ca8 (E′, F′, red), in 4 dpf larvae. Merged images (E″, F″, green and red). Images recorded at higher-magnification (F, F′, F″) reveal mRNA coexpression of kcnc3a and ca8 in PCs. Green fluorescent GFP-expressing PCs were isolated by FACS from dissociated heads of 4 dpf Tg(cpce-E1b:GFP)bz13 larval zebrafish through four sequential gatings (H, J, L, N). The same gatings applied to samples from dissociated heads of 4 dpf larval zebrafish of the brass strain (G, I, K, M). This allowed for discrimination of GFP-negative from GFP-positive cells of Tg(cpce-E1b:GFP)bz13 samples. G, H, Alive cells gate. BSC-A (area) and FSC-A (area). I, J, Single cells gate. FSC-W and FSC-H. K, L, Round cells gate. BSC-W and BSC-H. M–O, GFP-positive cells gate. No GFP-positive cells were detected within the GFP-positive cells gate in the brass sample, but only in the Tg(cpce-E1b:GFP)bz13 sample. Plots in G–N show 100,000 cells each, while plot in O shows 1,256,387 cells to allow for better visualization of the small percentage of GFP-positive PCs. P, Schematic drawings outlining annealing sites of specific primer pairs (red arrowheads) to detect the expression of groups of splice variants which encode different C-terminal amino acid sequences terminating with -WIPK, -PSIL, -VTNV, or -VLSF, respectively. Also see Figure 11-1 and Figure 11-2 supporting Figure 11P. Q, The top gel image shows single-cell RT-PCR analysis subsequent to FACS isolation of single PCs for detecting kcnc3a splice variants. Subsequent cloning of amplified PCR products, followed by sequencing failed to obtain expression data for isoforms containing exon 5 (X1, 2, 3, 4, 10), whereas the other variants shown in P were found to be expressed in single PCs purified from 4dpf Tg(cpce-E1b:GFP)bz13 larvae. RT-PCR on a plasmid containing each isoform (Q, bottom image) confirms the specificity of the PCR. The detection of ca8 confirms that the isolated single cell was a PC. R–U, mRNA expression of different kcnc3a splice variants in 4 dpf zebrafish larvae detected by whole-mount in situ hybridization. The different probes recognize isoforms X6/7/8/9 (R), X5 (S), X11 (T), or X12 (U), respectively. Colocalization (V″, W″, merged images) of kcnc3a-X12 (V, W, green), and ca8 (V′, W′, red) in PCs revealed by fluorescent in situ hybridization. Scale bars: D, U, 100 μm; E″, V″, 50 μm; F″, W″, 10 μm. Cb, Cerebellum; Hb, hindbrain; TeO, optic tectum.

