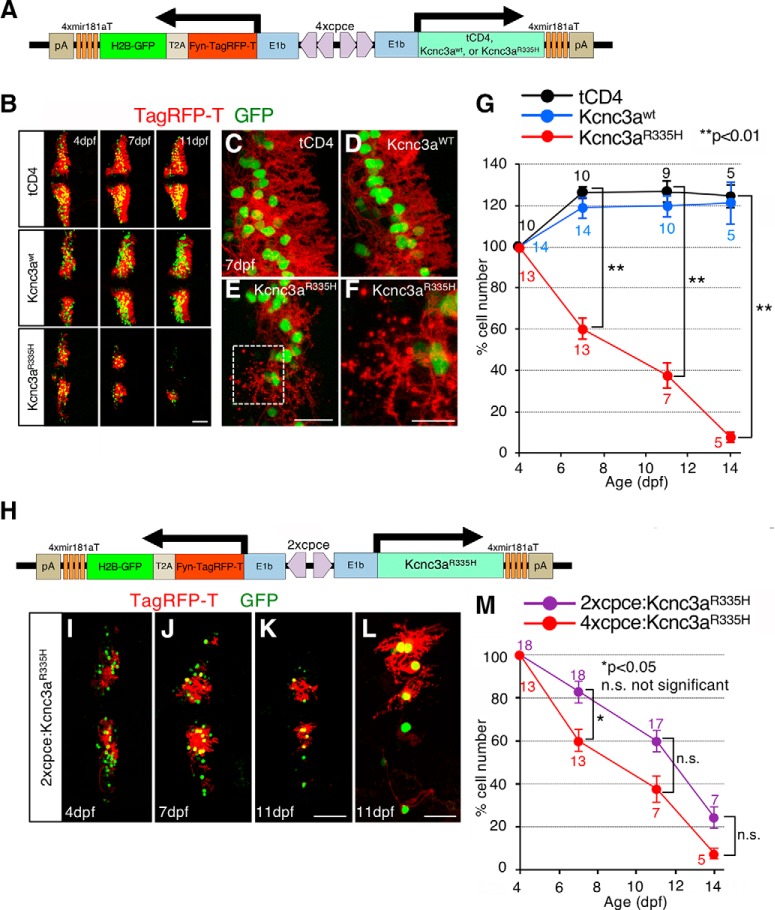
Figure 12.
Cerebellar neurodegenerative disease modeling for human SCA13. A, Schematic drawing of a bidirectional PC-specific expression system using 4xpce to express tCD4, Kcnc3awt, or Kcnc3aR335H together with nuclear H2B-GFP and membrane targeted Fyn-TagRFP-T reporter genes linked to a self-cleaving T2A peptide. B–G, Time course of Kcnc3aR335H-induced PC degeneration. B, Larvae injected with a construct expressing tCD4, Kcnc3awt, or Kcnc3aR335H (upper, middle or lower rows, respectively) and monitored in vivo at 4, 7, and 11 dpf by laser scanning confocal microscopy (note images of consecutive time points have been recorded from the same larva). C, Cerebellar PCs expressing tCD4 (C) or Kcnc3awt (D) exhibit highly arborized dendrites in 7 dpf larva, whereas PCs expressing Kcnc3aR335H (E, F) display atrophic and degenerative changes with fragmented red labeled puncta from dendritic or axonal structures. A higher-magnification image of the region marked by the white dashed rectangle (E) is presented in F. G, Percentage of surviving PCs in each larva was calculated at each time point in relation to the numbers of PCs of the same larva at 4 dpf. H, Schematic representation of the 2xcepc:Kcnc3aR335H construct expressing Kcnc3aR335H together with subcellular reporters (Fyn-TagRFP-T, red and H2B-GFP, green). I–K, The cerebellar region of the same larva injected with the construct shown in H was monitored in vivo at 4, 7, and 11 dpf, respectively, by laser scanning confocal microscopy. L, A higher magnified image of K displays degenerating PCs with atrophic and fragmented dendritic/or axonal structures. M, Percentage of surviving PCs in each larva. N values at each time point in G are reported in three different colors [tCD4 (black), Kcnc3awt (blue), Kcnc3aR335H (red)], and those in M are two [2xcpce:Kcnc3a R335H (purple), 4xcpce:Kcnc3aR335H (red)]. p values were determined by one-way ANOVA with post hoc Tukey HSD test. G, tCD4 versus Kcnc3aR335H (7 dpf) p = 0.0010053; tCD4 versus Kcnc3aR335H (11 dpf) p = 0.0010053; tCD4 versus Kcnc3aR335H (14 dpf) p = 0.0010053. M, 2xcpce:Kcnc3aR335H versus 4xcpce:Kcnc3aR335H (7 dpf) p = 0.0368766; 2xcpe:Kcnc3aR335H versus 4xcpce:Kcnc3aR335H (11 dpf) p = 0.165158; 2xcpce: Kcnc3aR335H versus 4xcpce:Kcnc3aR335H (14 dpf) p = 0.3135167. Scale bars: B, K, 50 μm; E, L, 20 μm; F, 10 μm.

