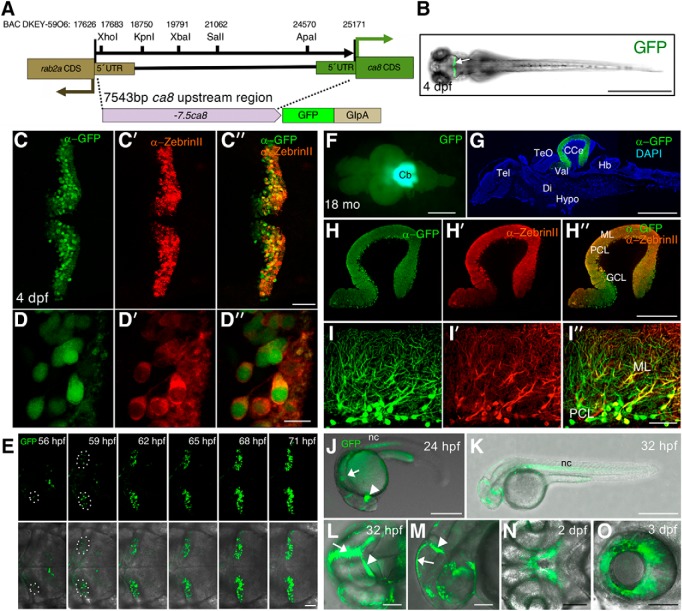
Figure 3.
Characterization of GFP expression pattern of Tg (-7.5ca8:GFP)bz12. The structure of the −7.5ca8:GFP transgene and its expression in Tg(-7.5ca8:GFP)bz12 fish. A, Schematic map of the −7.5ca8:GFP-globin intron-SV40 polyA (GIpA) transgene representing the 5′-upstream sequence of the ca8 gene, which corresponds to the sequence flanked by ca8 and rab2a coding regions (17626–25171 of BAC DKEY-59O6, GenBank accession number: CR847864). Unique restriction enzyme sites in this fragment are shown. B, Transgenic F2 larva at 4 dpf displays fluorescent GFP expression (arrow) in the cerebellum. PC-specific GFP expression of the transgene in the cerebellum of 4 dpf larvae was confirmed by co-immunostaining with anti-GFP (C, green) and anti-ZebrinII (C′, red) antibodies, a merged image demonstrates coexpression (C″, green and red channels), magnified views are shown in (D, D′, D″). E, Time-lapse imaging analysis of the cerebellum of Tg(-7.5ca8:GFP)bz12 larva between 56 and 71 hpf. The areas encircled by white dotted ellipses indicate emerging GFP-expressing PCs. Upper image row shows GFP fluorescence (green) recordings only that were overlaid in the lower row by transmitted light field images for anatomical orientation. Dorsal view (F), and a sagittal section (G) of an 18-month-old adult brain of Tg(-7.5ca8:GFP)bz12 fish expressing GFP (green) in the cerebellar region. Immunostaining was performed with anti-GFP antibody and counterstained with DAPI (G, blue). Costaining with anti-GFP (H) and anti-ZebrinII (H′) antibodies, that were merged to reveal coexpression in Purkinje cells (H″), magnified views are shown in (I, I′, I″). J–O, GFP expression pattern in Tg(-7.5ca8:GFP)bz12 larvae during embryonic stages. J, Lateral view of a 24 hpf embryo showing GFP (green) expression in the diencephalon (white arrowhead), the hindbrain (white arrow) and the notochord (nc). K, Lateral view of a 32 hpf embryo showing GFP expression in the notochord. Higher magnified dorsal (L) and lateral (M) views of the head regions of a 32 hpf embryo showing green fluorescent epithelia in the midline seam (white arrows), and the midbrain-hindbrain boundary (white arrowheads). N, Ventral view of a 2 dpf embryo showing GFP expression in the stomodeum. O, Lateral view of a 3 dpf larva showing GFP expression in the retinal pigment epithelium. Scale bars: B, G, J, K, 1 mm; H″, 400 μm; L–O, 100 μm; C″, E, I″, 50 μm; D″, 10 μm. CCe, Corpus cerebelli; CDS, coding sequence; Di, diencephalon; GCL, granule cell layer; Hb, hindbrain; Hypo, hypothalamus; ML, molecular layer; PCL, PC layer; Tel, telencephalon; TeO, optic tectum; UTR, untranslated region; Val, lateral division of the valvula cerebelli.

