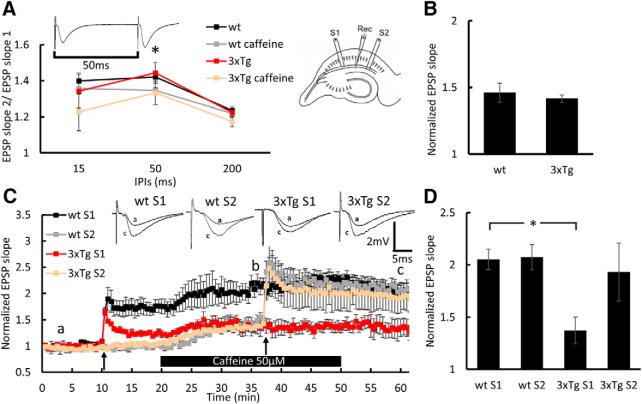
Figure 2.
Caffeine facilitates LTP in the 3xTg mice: extracellular EPSPs recorded in stratum radiatum of the hippocampus. A, Paired-pulse ratio at three different interpulse intervals (IPIs) before and after 20 min of 50 μm caffeine perfusion at times indicated by “a” and “b,” respectively, showing a significant effect of caffeine perfusion at 50 ms interval (wt: before, 1.42 ± 0.032; after, 1.35 ± 0.016; t3 = 3.427; p = 0.042; 3xTg: before, 1.44 ± 0.058; after, 1.33 ± 0.065; t4 = 3.038; p = 0.037, paired t test). Sample of two consecutive EPSPs recorded at a 50 ms interpulse interval are presented above the record. B, Bar graph presenting the effect of caffeine on EPSP slope in wt and 3xTg S2 at time point b. C, Normalized EPSP slopes recorded in response to stimulation of two pathways, as presented in the diagram above the record. Slices were perfused with 50 μm caffeine for 30 min during the bar shown below the record. First, HFS was delivered in the slope 1 (S1) pathway and the second HFS was delivered in the slope 2 (S2) pathway; both marked by black arrows. Sample EPSPs recorded at the time points a and “c” are presented above the record. D, Bar graph summarizes LTP results at time point c, showing significant reduction in LTP in the 3xTg group compared with the wt group (p = 0.0037, two-sample t test) that was restored back to normal in response to the S2 pathway stimulation during the perfusion of caffeine. Six-month-old male mice; n = 4–5 slices taken from 3 mice/group. *p < 0.05.

