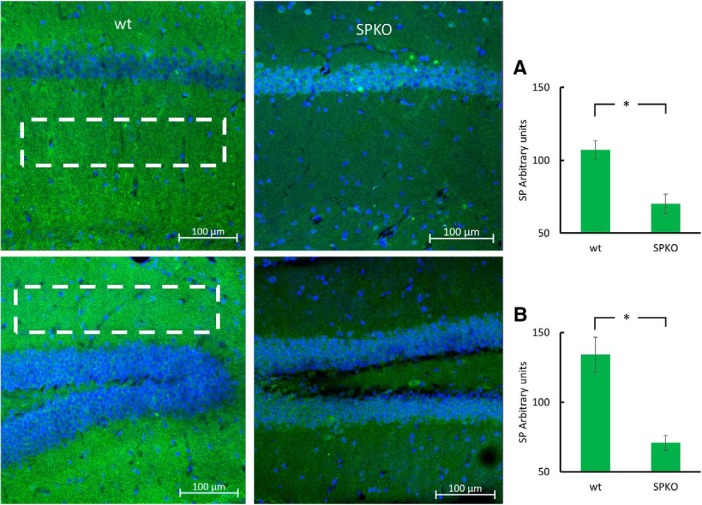
Figure 6.
SPKO mice do not express SP: representative immunostaining of CA1 area (top) and DG (bottom) of brain sections immunolabeled for SP (green) and DAPI (blue). A, Bar graph taken from stratum radiatum. B, Bar graph taken from molecular layer of the DG (as can be seen by the white rectangles) showing significantly lower SP expression in the SPKO group (p < 0.001 for both areas; two-tailed t test. Two-month-old male mice. n = 12 sections taken from 3 animals/group. *p < 0.05.

