
Table 2.
LC-MS/MS analysis of TPPU and synthetic putative TPPU metabolites.
| Meta. ID | RT (min) | Molecular ion (m/z) | Key fragments (m/z) | Fragmentation pattern |
|---|---|---|---|---|
| TPPU | 4.38 | 358 | 176, 85 | 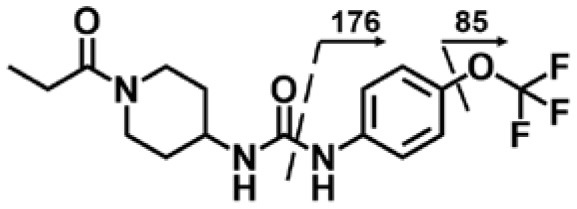 |
| M1 | 4.14 | 374 | 356, 176, 85 | 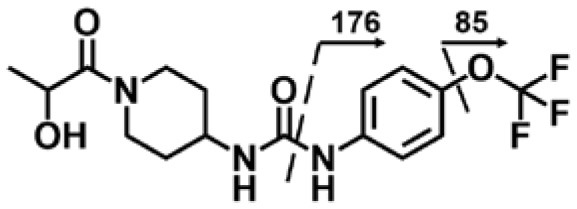 |
| M2 | 3.99 | 374 | 356, 176, 85 | 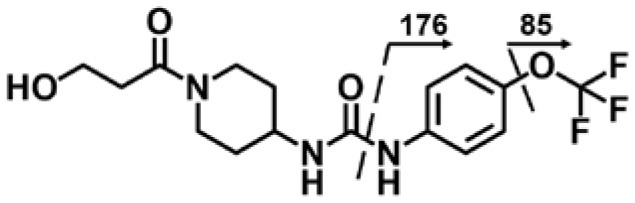 |
| M3 | 3.3 | 302 | 176, 85 | 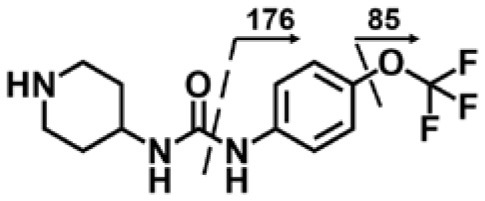 |
| M4 | 4.03 | 388 | 344, 176, 85 | 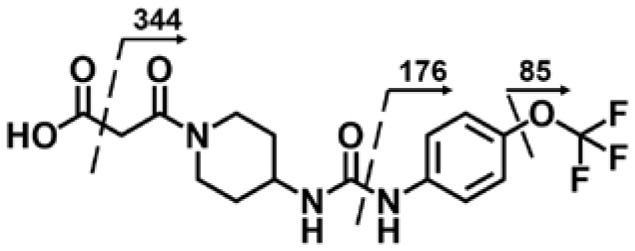 |
| α-Keto amide (M5) | 4.4 | 372 | 176, 85 | 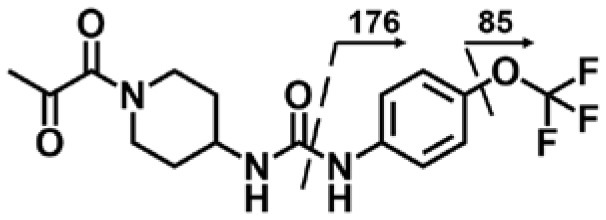 |
| Aniline (M6) | 4.32 | 178 | 93 | 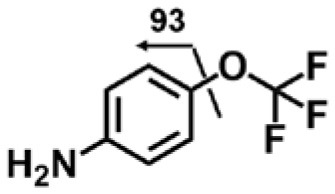 |
Fragment ions of TPPU, M1–M4, and α-keto amide metabolite were obtained by product ion scan in negative-ion mode. Fragment ions of aniline was obtained by product ion scan in positive-ion mode.