Fig. 1.
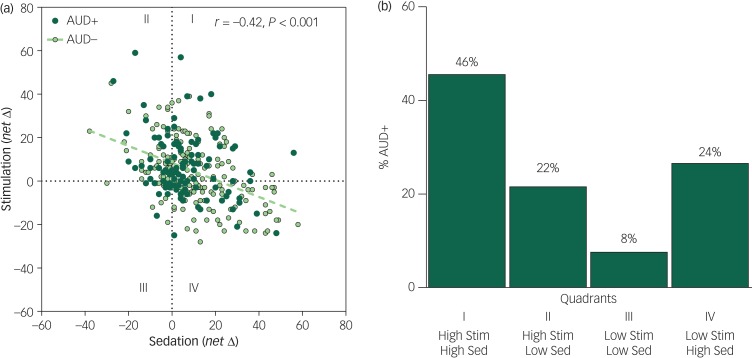
(a) Scatterplots and Pearson correlation between alcohol sedation (x-axis) and stimulation (y-axis) change scores calculated for the alcohol minus placebo session responses for the whole sample at initial testing at peak breath alcohol concentration (BrAC). (b) Bar graph of the frequency of participants with alcohol use disorder (AUD+) who were initially high- and low-alcohol responders at peak BrAC (change scores from placebo >0 for stimulation, <0 for sedation).
The majority n = 51 (46%; quadrant I in (a) were high responders (high stimulation and high sedation) compared with n = 9 (8%) low responders (quadrant III). There were also n = 24 (22%; quadrant II) high stimulation responders with low and n = 27 (24%; quadrant IV) with low stimulation and high sedation. The AUD+ frequency distribution in the quadrants was highly unlikely (P<0.001) resulting from a multinomial distribution with a random chance (i.e. 25% chance for each quadrant), suggesting AUD+ depended on the alcohol stimulation and sedation response pattern. High responders were ~5 times more likely (P<0.001 from a binomial test against a 50% chance likelihood) to develop AUD than low responders. Δ, change; Stim, stimulation; Sed, sedation.

