Fig. 2.

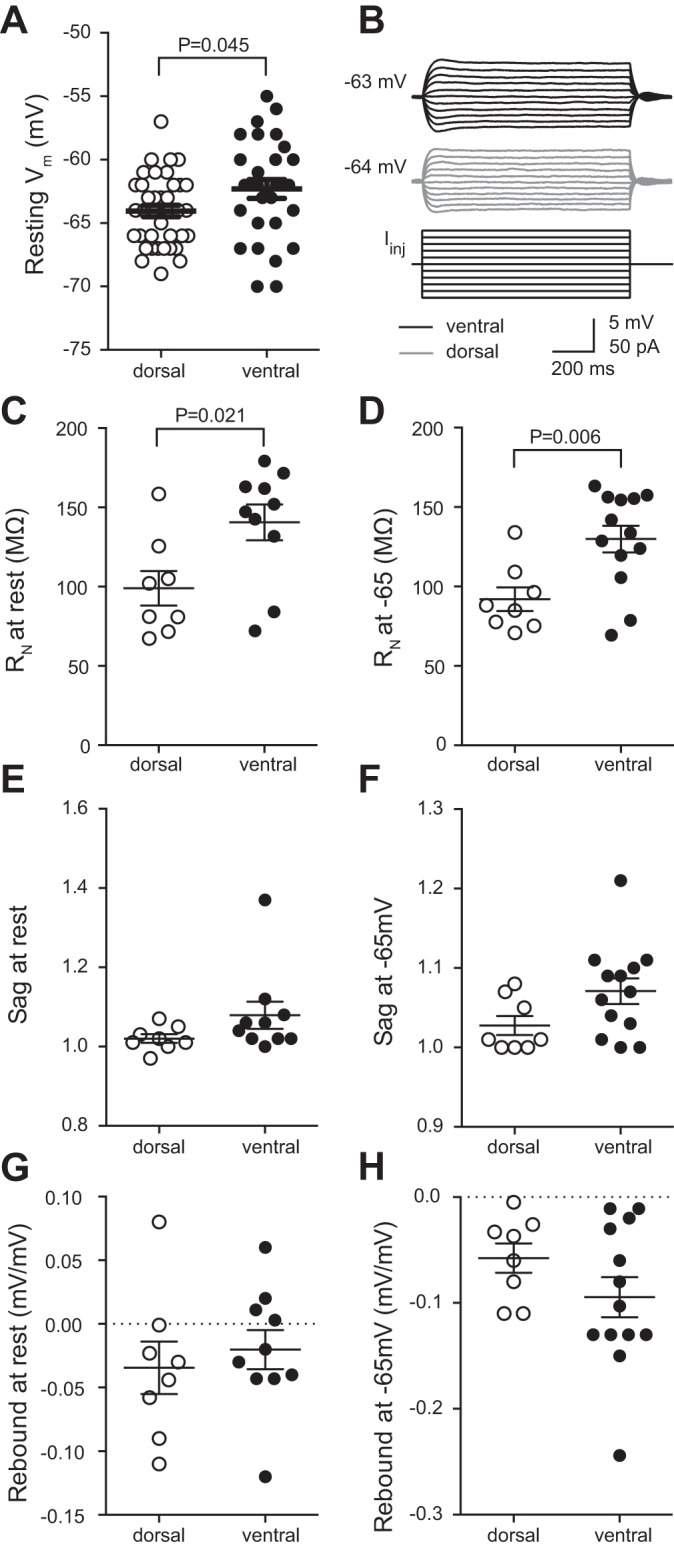
Comparison of subthreshold intrinsic membrane properties between dorsal and ventral CA1 neurons. A: ventral neurons have a more depolarized resting membrane potential (Vm) compared with dorsal CA1 neurons; n = 29 ventral cells and 38 dorsal cells from 43 mice). B: representative traces voltage responses from ventral (top) and dorsal (middle) CA1 neurons in response to a series of current injections (bottom). Resting Vm is shown at the right. C and D: ventral neurons have a higher input resistance (RN) than dorsal CA1 neurons measured from either rest (C; n = 10 ventral cells and 8 dorsal cells from 10 mice) or −65 mV (D; n = 13 ventral cells and 8 dorsal cells from 10 mice). E and F: there was no significant difference in voltage sag between ventral and dorsal CA1 neurons measured from either rest (E; n = 10 ventral cells and 8 dorsal cells from 10 mice) or −65 mV (F; n = 13 ventral cells and 8 dorsal cells from 10 mice). G and H: there was no significant difference in rebound slope between ventral and dorsal CA1 neurons measured from either rest (G; n = 10 ventral cells and 8 dorsal cells from 10 mice) or −65 mV (H; n = 13 ventral cells and 8 dorsal cells from 10 mice). Data are presented as means ± SE. A, E, and F analyzed using Mann-Whitney test. C, D, G, and H analyzed using t-test. See Supplemental Table S1 for details.
