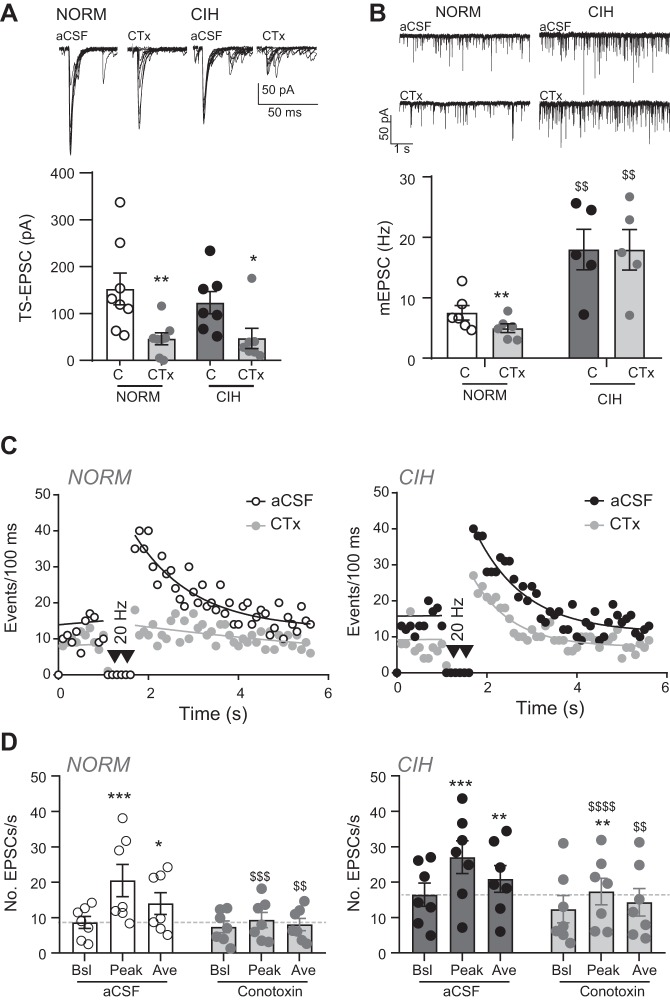
Fig. 2.
Effect of N-type calcium channel block with ω-conotoxin (CTx) on spontaneous, asynchronous and tractus solitarii (TS)-evoked activity. A: example of normoxic (NORM) and chronic intermittent hypoxia (CIH)-exposed TS-evoked excitatory postsynaptic currents (TS-EPSCs; overlay of 10 traces) in artificial cerebrospinal fluid (aCSF) and CTx. TS-EPSC amplitude decreased in CTx compared with their individual aCSF control (C) in NORM (n = 8) and CIH (n = 7) neurons (2-way RM ANOVA: drug, P = 0.006; hypoxia, P = 0.62, drug × hypoxia, P = 0.47). *P < 0.05; **P < 0.01, CTx vs. aCSF control, with Bonferroni multiple comparisons. B: example of NORM and CIH-exposed miniature EPSCs (mEPSCs; single traces) in aCSF and CTx. mEPSC frequency is reduced from aCSF control (C) by CTx in NORM (n = 6) slices but is unchanged in cells from CIH-treated (n = 5) animals (2-way RM ANOVA: drug, P = 0.001, hypoxia, P = 0.005, drug × hypoxia, P = 0.01). **P < 0.01, CTx vs. aCSF. $$P < 0.01, CIH vs. NORM with Bonferroni post hoc. C: diaries of events before and in response to 20-Hz TS stimulation in the absence (aCSF) and presence of CTx for individual NORM (left) and CIH-exposed (right) cells. Note the prominent decrease in asynchronous EPSCs by CTx in NORM. Events before TS stimulation are fit with a linear regression, whereas events following TS stimulation are fit via nonlinear curve. Events are binned per 100 ms. D: grouped data from experiments in C illustrate peak and average events are reduced to near baseline (pre-TS stimulation) in control (aCSF) for NORM (n = 7) cells, whereas the reduction of peak and average events by CTx is less pronounced in CIH (n = 7) cells (2-way RM ANOVA, NORM: drug, P = 0.10; EPSC, P = 0.001, drug × EPSC, P = 0.01; CIH: drug, P = 0.10; EPSC, P = 0.002; drug × EPSC, P = 0.0006). Dashed line indicates aCSF baseline events. Ave, average; Bsl, baseline. *P < 0.05; **P < 0.01; ***P < 0.001, peak or average vs. baseline (pre-TS stimulation) with Bonferroni post hoc. $$P < 0.01; $$$P < 0.001; $$$$P < 0.0001, CTx vs. aCSF control for each respective parameter with Bonferroni post hoc.

